The impact of weather on influenza seasons in Calgary since 2022
Kyle Brittain
1/20/202615 min read
Introduction
In Canada, respiratory illnesses like influenza tend to peak in the late fall and winter. Of several important environmental and human factors that conspire together to cause these peaks in activity, certain meteorological variables have been found to play a key role in the timing and severity of seasonal influenza epidemics.
Numerous studies have been conducted around the world that explore the link between weather and flu. The results of these studies have revealed the importance of two specific meteorological variables: temperature, and absolute humidity.
In this informal study, trends in temperature and absolute humidity are compared to wastewater data of influenza A in Calgary since March 2022, to see if an observable relationship may be present over the past four flu seasons. The result shows that seasonal influenza epidemics may be initiated by declines in absolute humidity to a certain threshold, and that maximum rates of increase in viral copies of influenza A observed in wastewater data may be tied to a relatively narrow range of absolute humidity and temperature.
Part one: Overview of flu spread
What is influenza, and why does it tend to be worst in late fall and winter?
Influenza - often referred to as "flu" for short, is an acute, highly contagious, viral respiratory illness. Its symptom profile frequently includes fever, body aches, and cough, with symptoms of illness commonly lasting up to 7-10 days. For some, the illness is relatively mild and self-limiting, while other more vulnerable populations may see more severe outcomes. In Canada, influenza is one of the ten leading causes of death, leading to about 15,000 hospital stays and 3,500 deaths every year (Government of Canada 2026).
The most common types of flu are influenza A and influenza B. Influenza A can be further divided into the two most currently prevalent subtypes, which include H3N2 and H1N1 - with epidemics in Canada tending to occur earlier in H3N2-dominated seasons rather than in H1N1-dominated seasons (He et al. 2013). Only influenza A viruses are known to cause pandemics (Centers for Disease Control and Prevention 2025). Symptom profiles often vary by virus type and subtype, with one subtype tending to dominate a given season over another (Lee et al. 2023).
A variety of host and environmental factors are likely responsible for the increased risk of influenza infection in late fall and winter. In higher-latitude regions of the world, the human immune system may be suppressed during long, dark winters owing to, among other factors, a lack of vitamin D synthesis from sunlight (Hayes et al. 2003). When the weather turns cold, people are also more likely to congregate indoors, increasing the risk of exposure (Willem et al. 2012).
Colder weather is also naturally drier, as less water vapour exists in the air at colder temperatures. These cold, dry conditions tend to be more prevalent in winter, with drier conditions indoors as well. Combined, these can cause flu viruses to be transmitted more easily. Flu viruses themselves may be able to survive longer at lower temperatures (Lofgren et al. 2007), while the cooling and drying of the respiratory tract can increase the risk of infection (Jaakkola 2014). Larger droplets expelled through coughing and sneezing can evaporate more readily in dry conditions, enabling viral particles to stay suspended in the air for longer (Shaman and Kohn 2009).
With these factors in mind, it is clear that the temperature and moisture content of the air play a significant role in flu transmission. Next, let's break down the concept of "humidity" a little more.
What is absolute humidity and its relation to temperature?
Water vapour is water in its invisible, gaseous state, and can be measured in a few different ways. Absolute humidity is one such metric, which is the actual amount water vapour in the air, regardless of air temperature, measured in grams per metre cubed (g/m3) (NOAA/National Weather Service 2024).
Absolute humidity is strongly correlated with temperature (Peci et al. 2019). The warmer the temperature of the air, the greater its capacity to hold moisture, and vice versa. Therefore, at colder temperatures, the air is "drier" overall - regardless of whether it is saturated. Absolute humidity contrasts with relative humidity, which is the ratio, expressed as a percent, of the amount of water vapour in the air compared to the amount it could hold at a given temperature and pressure.
For example, when the air temperature is 20°C with a relative humidity of 50% (halfway to saturation at that temperature), the absolute humidity is about 8.6 g/m3. At 100% relative humidity, absolute humidity is about 17.2 g/m3. That warmer air can contain more water vapour explains why, for example, air with a temperature of -10°C and a relative humidity of 100% could be considered "drier" (in that it contains less moisture) than warmer air at 20°C with a lower relative humidity of 20%.
The onset of influenza seasons in mid-latitude regions, such as the United States, has been found to be associated with episodes of below normal absolute humidity during previous weeks (Shaman et al. 2010). A study on patterns of influenza A spread in Canada by He et al. 2013 found that cold season flu outbreaks tend to emerge first in Alberta, with a gradual eastward progression across the country thereafter. This may be tied to patterns of absolute humidity and temperature that fall to certain thresholds before the rest of southern Canada to the east.
Figures 1 and 2 below show Calgary's annual cycle of daily mean temperature and absolute humidity. Summers are warmer and moister than winter, whose colder and drier conditions are more supportive of influenza transmission.
Part two: Recent flu seasons in Alberta
To begin, let's look back at the characteristics of the past several flu seasons in Alberta as a whole. The following three figures are screenshots from the Government of Alberta's respiratory virus dashboard, which are based on laboratory-confirmed cases of the flu.
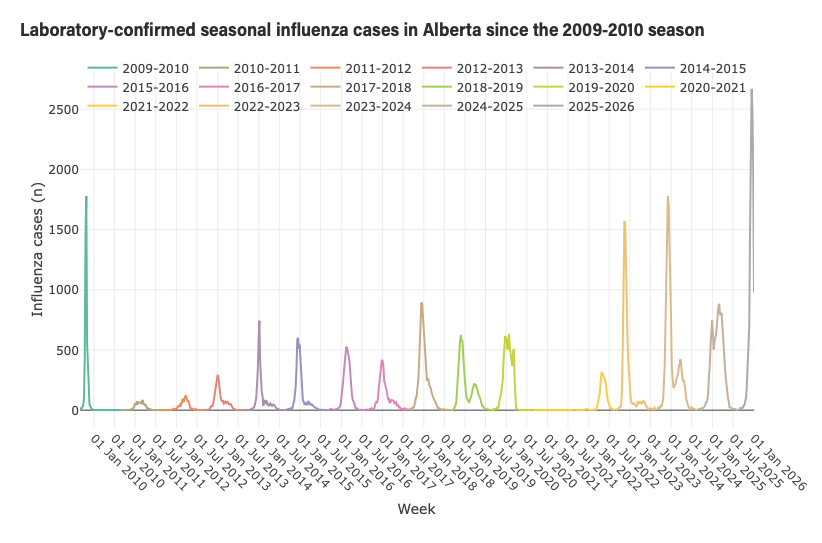
Figure 1: Annual cycle of daily mean temperature in Calgary, based on the 1991-2020 climatology.
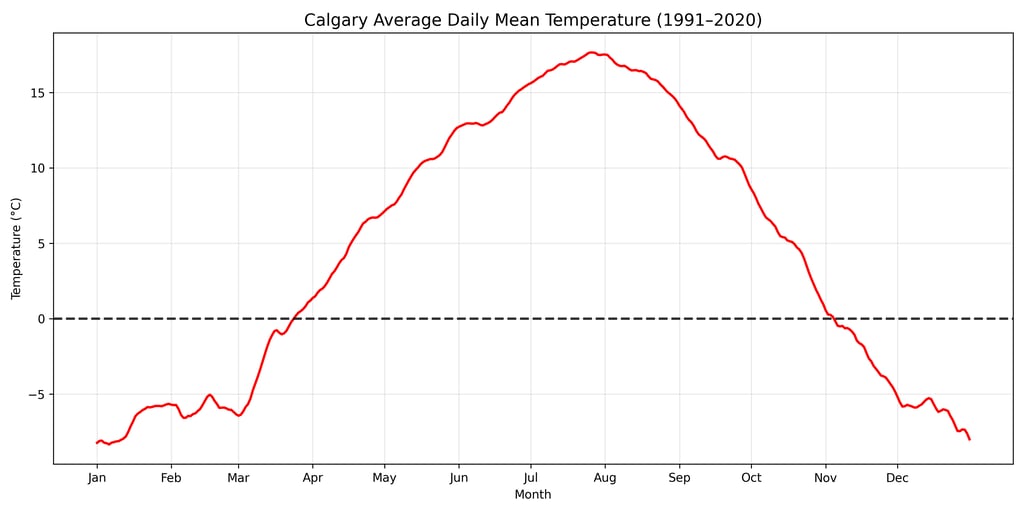
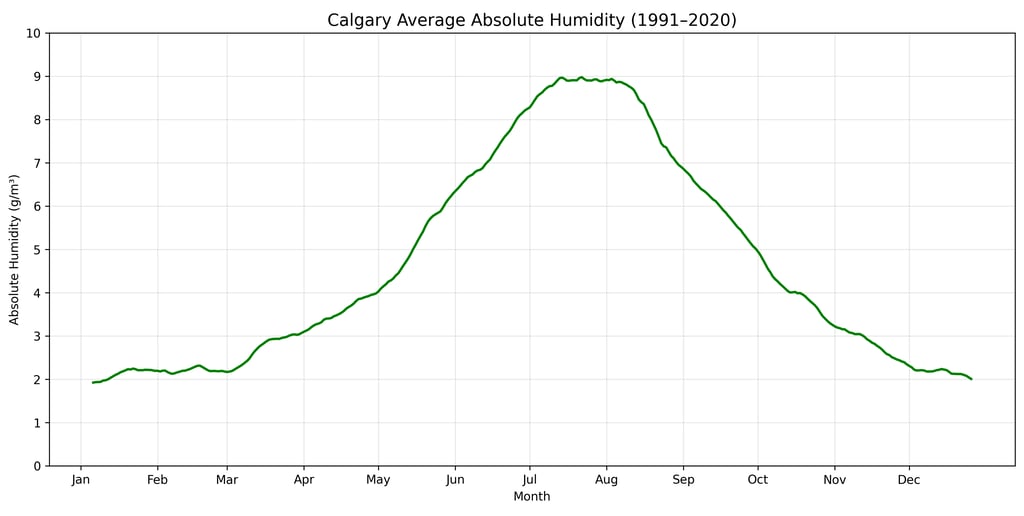
Figure 2: Annual cycle of daily mean absolute humidity in Calgary, based on the 1991-2020 climatology.
Figure 3: Laboratory-confirmed influenza cases in Alberta since the 2009/10 flu season. Screenshot credit: Government of Alberta.

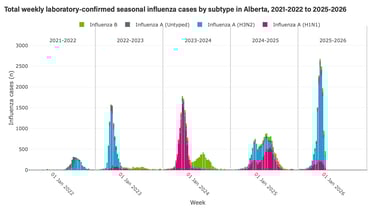
Figure 4: Laboratory-confirmed influenza cases by subtype in Alberta since the 2021/22 flu season. Screenshot credit: Government of Alberta.
The severity of flu season in Alberta varies from year to year. The H1N1-dominated season of 2009/10 that peaked in October 2009 was followed by several less-severe seasons (see Figure 3). No lab-confirmed cases were recorded during the first full winter season of the Covid-19 pandemic, in 2020/21. Since that time, lab-confirmed cases have significantly increased - though population growth and increased post-pandemic testing may play a role in this increase.
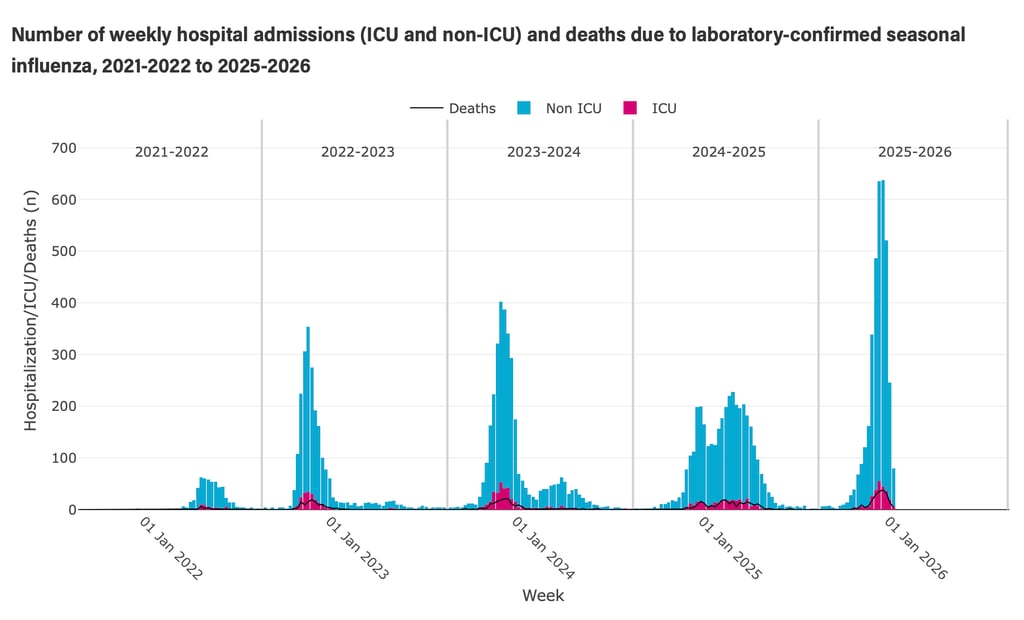
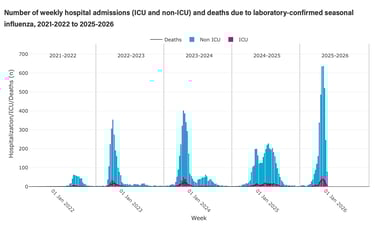
Figure 5: Severe outcomes from influenza seasons in Alberta since 2021/22, including hospitalizations and deaths. Screenshot credit: Government of Alberta.
Figures 4 and 5 provide a more detailed look into the characteristics of flu seasons since 2021/22. Variability in the dominant influenza A subtype is noted in Figure 4. The 2022/23 and 2025/26 seasons were dominated by H3N2, while 2023/24 was dominated by H1N1 - along with a notable springtime peak of influenza B in 2024. The unusually protracted season of 2024/25 season saw peaks in both subtypes, with H3N2 dominating earlier and H1N1 later.
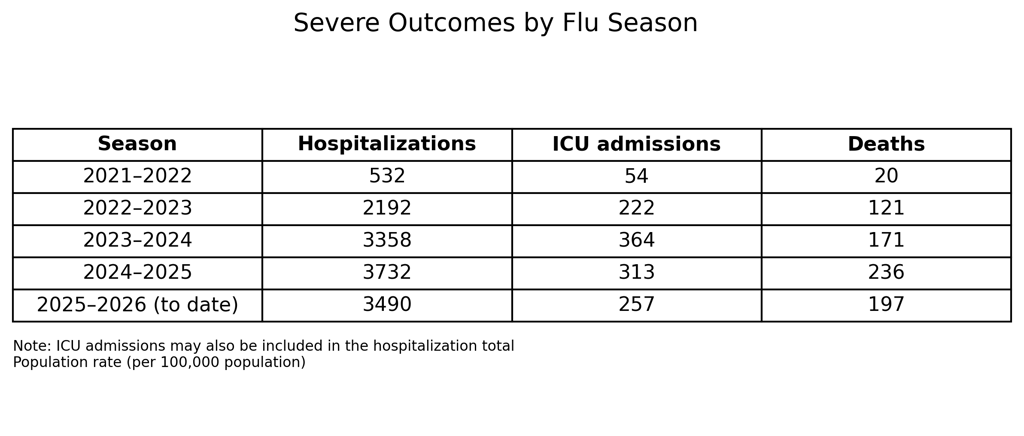
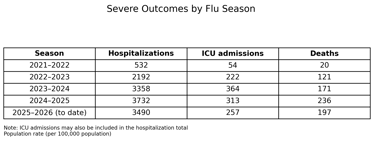
Table 1: Severe outcomes by flu season in Alberta since 2021/22. 2025/26 season data runs until the week of January 11, 2026. Data obtained from Government of Alberta's respiratory virus dashboard.
As seen in Table 1, flu seasons generally increased in severity between 2021/22 and 2024/25, based on total hospitalizations and deaths in Alberta - even as a percentage of the population (as indicated on the Government of Alberta's respiratory virus dashboard). As of the time of writing in late January 2026, the peak of the current flu season has passed and is winding down. The H3N2-dominated season will come close, but may end up having fewer severe outcomes than the 2024/25 season overall, despite having the highest peak laboratory-confirmed cases since at least 2009.
Part three: Weather and flu seasons in Calgary since 2022
Supporting data
This informal study compares the meteorological variables of temperature and absolute humidity with influenza A trends in south Calgary over the four flu seasons since 2022/23. A key difference in the influenza data, compared with that in Part Two, is that it is based on wastewater data (measured in viral copies per millilitre) - as opposed to laboratory-confirmed cases. Wastewater data can offer benefits over lab-confirmed case counts, as it eliminates testing biases and can indicate the rate of community flu spread closer to real-time (Maere et al. 2022). However, wastewater-based surveillance is not free of its own biases, which can include how it is sampled and analyzed, how the sewer network is engineered, and changeable weather conditions - including the diluting effect of excess runoff (Joung et al. 2023). Wastewater data was gathered from the Covid Tracker website, hosted by the Centre for Health Informatics at the Cumming School of Medicine, University of Calgary. Screenshots of the data as presented on the site can be seen below in Figures 6 and 7.
Temperature and absolute humidity data was obtained for Calgary International Airport, from Environment and Climate Change Canada's climate data repository. Both the daily mean 1991-2020 climatology for these variables was calculated and generated from this data, along with the observed values during the past four flu seasons.
The data is plotted as a time series during flu season, which was selected to run from September 1 to April 1 - with the exception of the current season, which has been truncated to early January 2026. Both climatological and observed values of temperature and absolute humidity are plotted, along with observed flu wastewater data in G.C./mL (gene copies per millilitre). The range of temperature, absolute humidity, and wastewater is based on the observed maxima and minima of these values since 2022, with the maximum values of the 2022/23 seasonal peak in influenza A being plotted as a baseline.

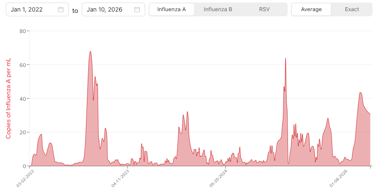
Figure 6: Wastewater data of influenza A at "Calgary South" since March 2022. Screenshot credit: Centre for Health Informatics, Cumming School of Medicine, University of Calgary.
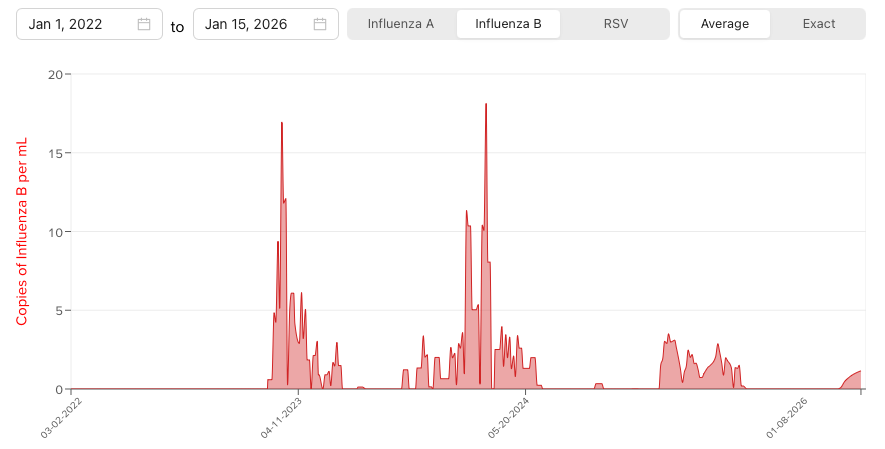

Figure 7: Wastewater data of influenza B at "Calgary South" since March 2022. Note the early spring peaks at similar times, on March 13, 2023 and March 11, 2024. There will be no further discussion on trends in influenza B in this article. Screenshot credit: Centre for Health Informatics, Cumming School of Medicine, University of Calgary.
2022/23 flu season:
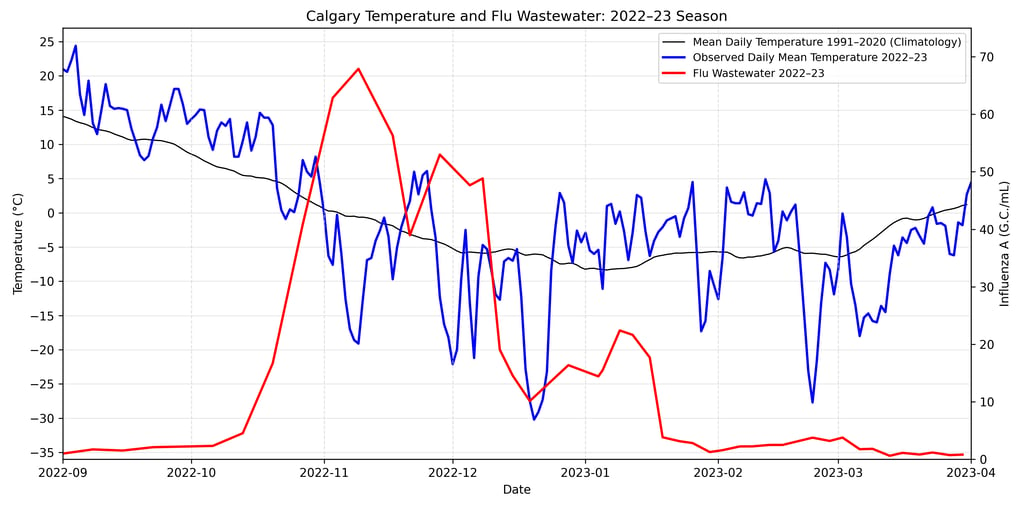
Figure 8: Flu wastewater trends, along with observed climatological daily mean temperature during the 2022/23 flu season.
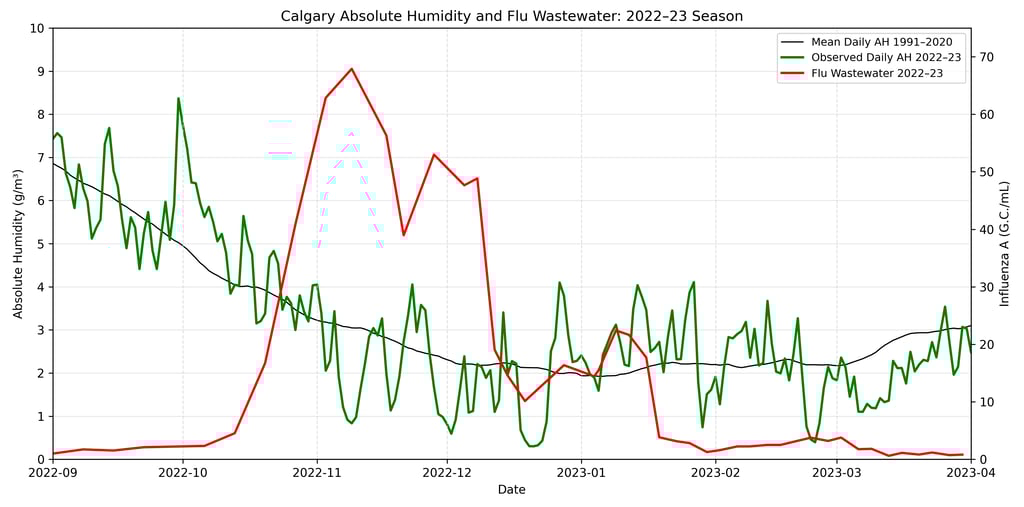
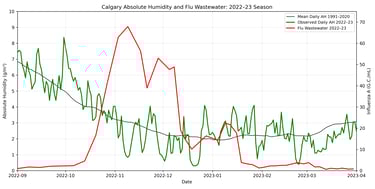
Figure 9: Flu wastewater trends, along with observed and climatological daily mean absolute humidity during the 2022/23 flu season.
Peak viral copies of influenza A in wastewater were measured on November 9, 2022 at Calgary South, following a rapid increase between October 20 and November 3. The monitoring sites at both Calgary North and Calgary Far South also recorded their seasonal peaks on the same day (see the Covid Tracker website). On the Government of Alberta's respiratory virus dashboard, the provincial peak in lab-confirmed cases occurred the week of November 13.
The initial increase of influenza A was preceded by a sharp drop in absolute humidity (AH) to a minimum of about 4 g/m3, between the end of September and the second week of October (see Figure 9). This may be important despite values of AH initially being well-above seasonal, given the findings of other studies that found flu activity began to increase in the community following declines in AH. Based on temperature (T) data (Figure 8), we can see that the significant drop in AH was not matched by a significant drop in T during this time.
The peak growth rates in wastewater data during the week of October 21-28 were associated with T and AH values in a relatively narrow range, with the weekly average of daily mean T of 1.99°C and the weekly average of daily mean AH of 3.92 g/m3. See Table 2 and Figure 16 below for the observed weekly range of T and AH.
2023/24 flu season:
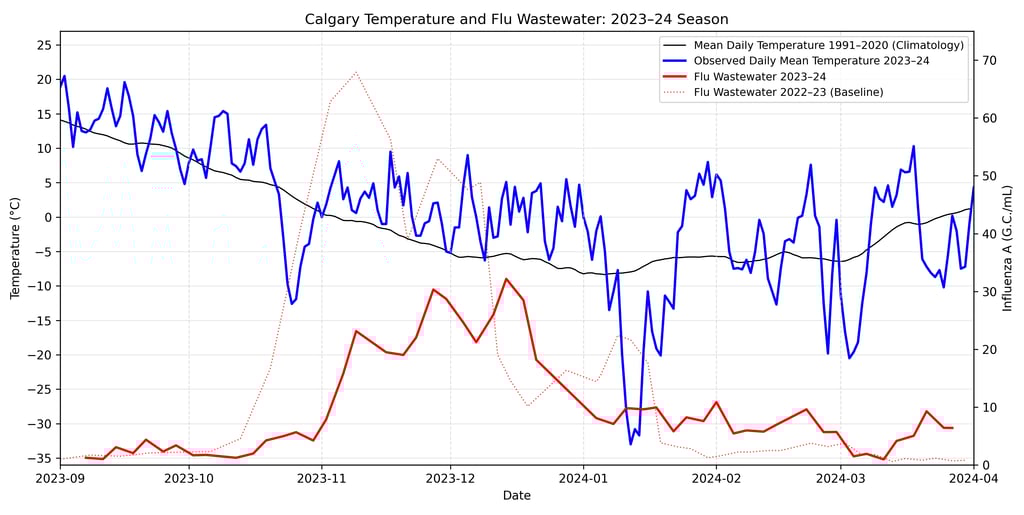
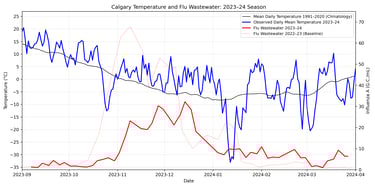
Figure 10: Flu wastewater trends, along with observed climatological daily mean temperature during the 2023/24 flu season.

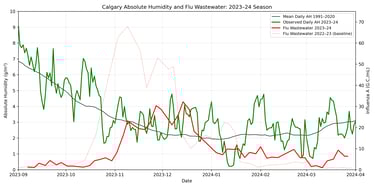
Figure 11: Flu wastewater trends, along with observed and climatological daily mean absolute humidity during the 2023/24 flu season.
Peak viral copies of influenza A in wastewater at Calgary South were measured on December 14, 2023, following two preceding peaks. Elsewhere in Calgary, the seasonal peak was reached on November 27, 2023 at Calgary North and Calgary Far South (the second peak seen in Figures 10 and 11). Lab-confirmed cases reached their peak in Alberta as a whole during the week of December 3, 2023.
The initial increase flu activity observed in wastewater occurred a few days after the significant drop in AH (to values below 2 g/m3) and T observed between mid-October and the last week of the month.
T and AH rebounded somewhat into a relatively consistent range from late October through late December, which encompassed all three peaks in flu activity. The peak growth observed during the week of November 3-10 was associated with a weekly average of daily mean T of 3.72°C, and a weekly average of daily mean AH of 3.73 g/m3. See Table 2 and Figure 16 below for the observed weekly range of T and AH.
2024/25 flu season:
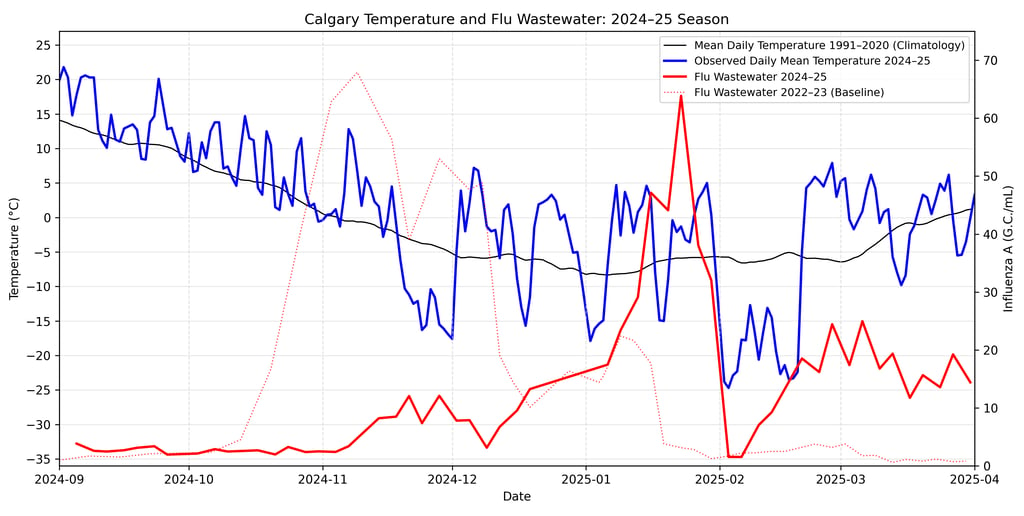
Figure 12: Flu wastewater trends, along with observed climatological daily mean temperature during the 2024/25 flu season.
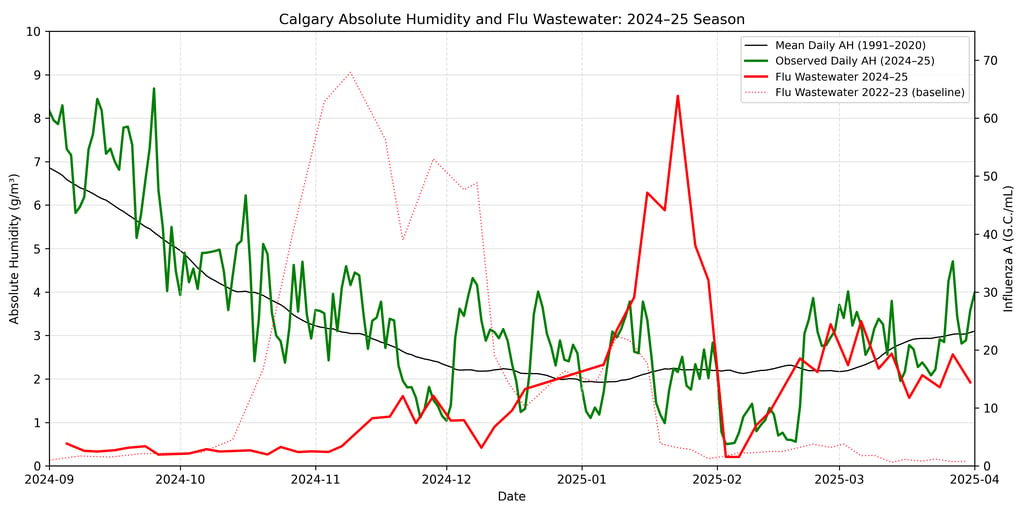
Figure 13: Flu wastewater trends, along with observed and climatological daily mean absolute humidity during the 2024/25 flu season.
Peak viral copies of influenza A in wastewater at Calgary South were measured on January 23, 2025, which was also the seasonal peak recorded at Calgary North and Calgary Far South. Lab-confirmed cases in Alberta as a whole peaked during the week of March 2, 2025, but revealed a long, challenging flu season as both subtypes reached relative peaks in activity, as discussed in Part Two.
The initial rise in activity during mid-November was not preceded by any significant drops in T or AH, but rather followed a seasonal decline into a similarly narrow range of T and AH as noted in the previous two seasons.
Moreover, the most significant growth of flu in wastewater that occurred during much of the week of January 10-17 was associated with a similarly narrow range in T and AH. The weekly average of daily mean T was 1.9°C, and the weekly average of daily mean AH was 3.25 g/m3. See Table 2 and Figure 16 below for the observed weekly range of T and AH.
2025/26 flu season:
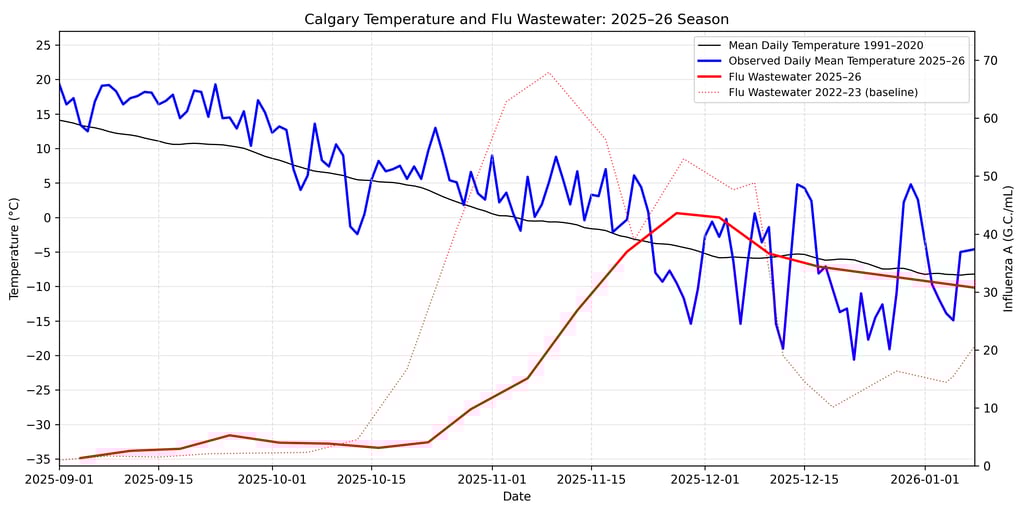
Figure 14: Flu wastewater trends, along with observed climatological daily mean temperature during the 2025/26 flu season.
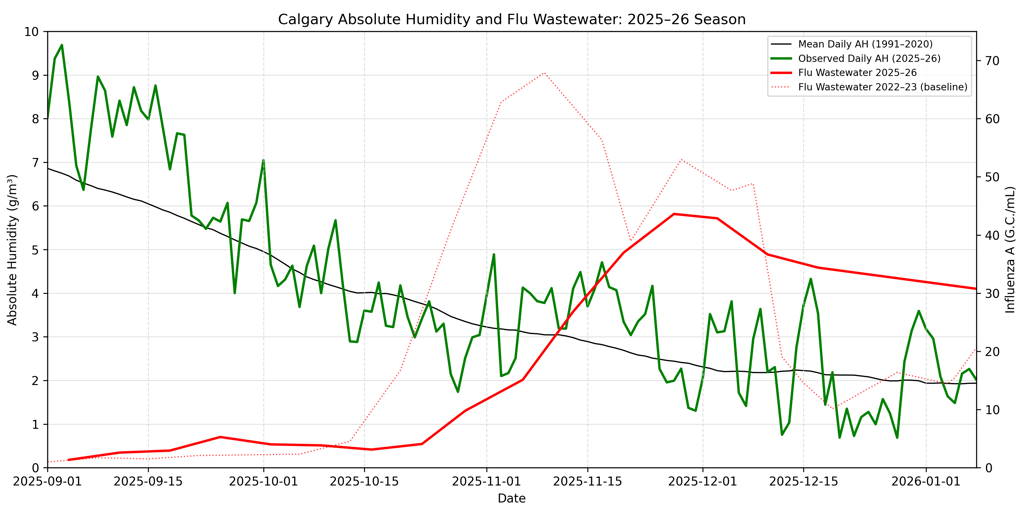
Figure 15: Flu wastewater trends, along with observed and climatological daily mean absolute humidity during the 2025/26 flu season.
Peak viral copies of influenza A in wastewater at Calgary South were measured on November 27, 2025, which was the same peak recorded at Calgary Far South. Calgary North reached peak activity on December 3, while provincial lab-confirmed cases peaked during the week of December 14.
The initial rise in activity in late October was not preceded by any significant drops T and AH, but rather a gradual, seasonal decline into the similar, relatively narrow range of values observed over previous seasons - including AH values generally below about 4 g/m3.
Moreover, peak growth rates of flu in wastewater observed during the week of November 7-14 was associated with a relatively narrow range of T and AH values, similar to the seasons above. The weekly average of daily mean T was 4.29°C, while the weekly average of daily mean AH was 3.68 g/m3. See Table 2 and Figure 16 below for the observed weekly range of T and AH.
Discussion and conclusion
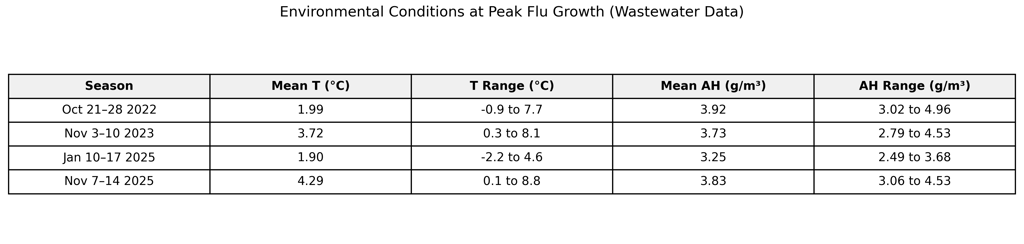
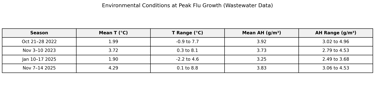
Table 2: Weeks with peak growth of flu in wastewater by season, with average weekly daily mean T and AH and their observed ranges during those weeks.
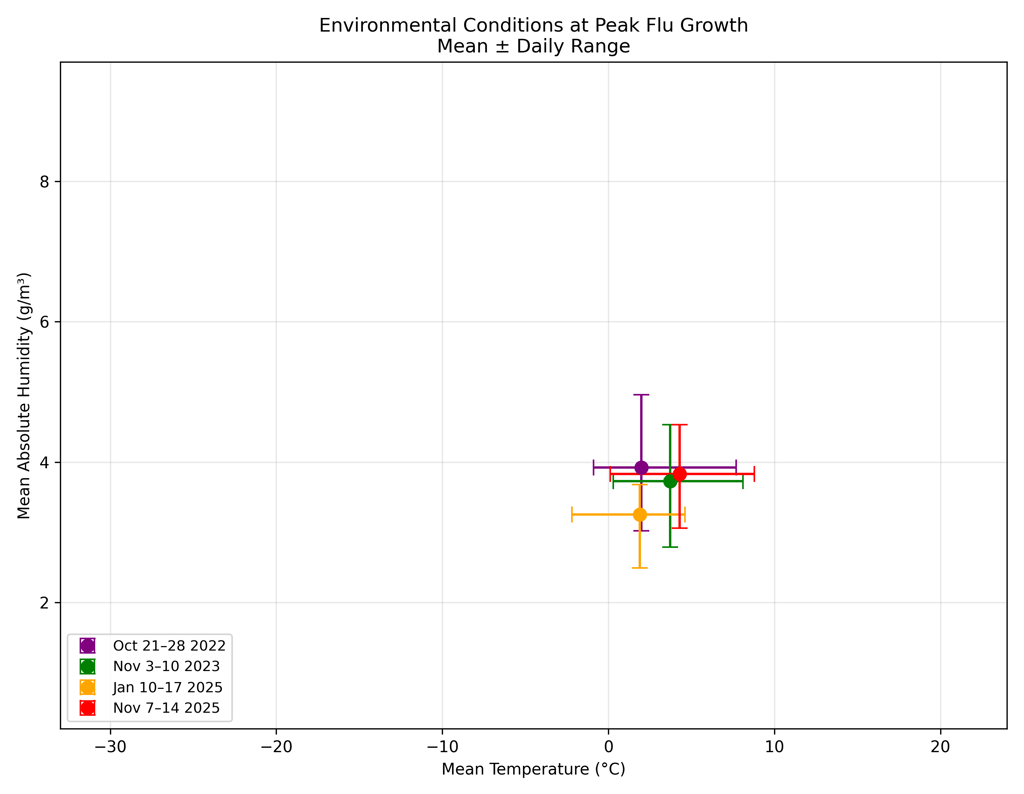

Figure 16: Scatter plot of mean temperature and mean absolute humidity during weekly periods of peak flu growth, with horizontal and vertical bars indicating the daily minimum–maximum ranges.
This informal study has a few obvious weaknesses, foremost among them the limited sample size of only 4 flu seasons. This precludes more rigorous statistical analyses, as well as confidence in the findings and in the strength of correlation between variables. However, the findings are interesting, and worth testing in future flu seasons. Moreover, while absolute humidity and temperature are strongly correlated, it may be worthwhile to attempt to further disentangle their relative contributions within a larger sample size.
Nonetheless, the study highlights an area of potentially important future research that may help us anticipate the onset and severity of subsequent flu seasons based forecast weather conditions. Its findings may also be useful for studies in other locations across Canada and beyond, to see if these findings hold there as well. These findings further support the guidance of medical professionals for protecting against seasonal influenza, including maintaining adequate indoor humidity, supporting immune health (e.g., vitamin D supplementation where appropriate), and receiving the annual influenza vaccine.
References
Centers for Disease Control and Prevention, 2025: Types of influenza viruses. Accessed 21 January 2026, https://www.cdc.gov/flu/about/viruses-types.html
Government of Canada, 2026: Flu (seasonal influenza). Accessed 16 January 2026, https://www.canada.ca/en/public-health/services/diseases/flu-influenza.html
Hayes, C.E., Nashold, F.E., Spach, K.M., Pedersen, L.B., 2003: The immunological functions of the vitamin D endocrine system. Cell. Mol. Biol. (Noisy-le-grand), 49(2), 277-300, https://pubmed.ncbi.nlm.nih.gov/12887108/
He, D., J. Dushoff, R. Eftimie, and D. J. D. Earn, 2013: Patterns of spread of influenza A in Canada. Proc. Roy. Soc. B, 280, 20131174, https://doi.org/10.1098/rspb.2013.1174.
Jaakkola, K., A. Saukkoriipi, J. Jokelainen, and Coauthors, 2014: Decline in temperature and humidity increases the occurrence of influenza in cold climate.Environ. Health,13, 22, https://doi.org/10.1186/1476-069X-13-22.
Joung, M. J., C. S. Mangat, E. M. Mejia, A. Nagasawa, A. Nichani, C. Perez-Iratxeta, S. W. Peterson, and D. Champredon, 2023: Coupling wastewater-based epidemiological surveillance and modelling of SARS-CoV-2/COVID-19: Practical applications at the Public Health Agency of Canada.Can. Commun. Dis. Rep.,49, 166–174, https://doi.org/10.14745/ccdr.v49i05a01.
Lee, H. J., G. Ryu, and K. I. Lee, 2023: Symptomatic differences between influenza A/H3N2 and A/H1N1 in Korea.J. Clin. Med.,12, 5651, https://doi.org/10.3390/jcm12175651.
Lofgren,E., Fefferman,N.H., Naumov,Y.N.,Gorski,J.,Naumova,E.N.,2007:Influenza Seasonality: Underlying Causes and Modeling Theories. J. Virol., 81(11), https://doi.org/10.1128/jvi.01680-06
Maere, T., J.-D. Therrien, and P. Vanrolleghem, 2022:Normalization practices for SARS-CoV-2 data in wastewater-based epidemiology.Technical Report prepared for the Public Health Agency of Canada (PHAC), Université Laval, Québec, Canada, https://nccid.ca/wp-content/uploads/sites/2/2023/02/Normalization-practices-Technical-Report-Final3.pdf
NOAA/National Weather Service, 2024: Humidity. Accessed 16 January 2026, https://www.weather.gov/lmk/humidity.
Peci, A., A. L. Winter, Y. Li, S. Gnaneshan, J. Liu, S. Mubareka, and J. B. Gubbay, 2019: Effects of absolute humidity, relative humidity, temperature, and wind speed on influenza activity in Toronto, Ontario, Canada.Appl. Environ. Microbiol.,85, e02426-18, https://doi.org/10.1128/AEM.02426-18.
Shaman, J., and M. Kohn, 2009: Absolute humidity modulates influenza survival, transmission, and seasonality.Proc. Natl. Acad. Sci. U.S.A.,106, 3243–3248, https://doi.org/10.1073/pnas.0806852106.
Shaman, J., Pitzer, V.E., Viboud, C., Grenfell, B.T., Lipsitch, M., 2010: Absolute Humidity and the Seasonal Onset of Influenza in the Continental United States.PLoS Biology.,8(2), https://doi.org/10.1371/journal.pbio.1000316
Willem, L., Van Kerckhove, K., Chao, D.L., Hens, N., Beutels, P., 2012: A Nice Day for an Infection? Weather Conditions and Social Contact Patterns Relevant to Influenza Transmission.PLoS ONE.,7(11), https://doi.org/10.1371/journal.pone.0048695
Seasonal epidemics of influenza A tend to peak during the cold season, when falling temperature and absolute humidity help to create the conditions for efficient virus transmission in the late fall and winter. This has been well-established in the relevant literature, and is reflected in the current, informal Calgary-based study.
This study also reveals two other findings of potential significance:
1) The initial, seasonal increase in influenza A activity is preceded by a decline in absolute humidity to about 4 g/m3 or below. Viral copies are seen to increase in wastewater within a week of these values being attained, which often occurs between mid-October and early November. The decline in absolute humidity (usually associated with a decline in temperature) may occur gradually or suddenly, as long as favourable values are attained.
2) Across four flu seasons, the most rapid increases in wastewater concentrations of influenza A consistently occurred during periods when daily mean air temperature and absolute humidity were both within a relatively narrow range (see Table 2 and Figure 16 below). Despite the large range of seasonal variability (−33 to 24°C; 0.2 to 9.7 g/m3), peak growth periods clustered between mean daily temperatures of 2 to 4°C and around a mean daily absolute humidity of between 3 and 4 g/m3. Beyond the observed peak of seasonal flu activity, no further growth is favoured, even if absolute humidity and temperature values remain within this range.