Did the Jasper Wildfire Generate Tornadoes?
Kyle Brittain
12/22/2025
The Jasper wildfire produced extreme fire-generated winds, causing extensive damage in parts of Jasper National Park. The available evidence suggests that at least three separate vortex-generated wind events were responsible for much of the damage, which occurred sometime between the afternoon of 23 July and the afternoon of 24 July 2024, several kilometres south of the Jasper townsite. The damage included everything from extensive blowdown of mature pine forests to the scouring of asphalt and the lofting of large, heavy objects at the Wabasso Campground.
The recent release of an official study from Natural Resources Canada of the Jasper Wildfire Complex by the Jasper Fire Documentation, Reconstruction, and Analysis Task Team (JFDRATT 2025), along with a pair of videos hosted by Canada Wildfire that included operational perspectives (Canada Wildfire 2025a) and documentation of fire behaviour (Canada Wildfire 2025b) offer a detailed look into much of what transpired during that period.
Given the severity of fire behaviour and extent of the damage observed, a central question arises: did the Jasper wildfire generate tornadoes? In attempting to answer this question, we begin with an overview of important terminology and the current understanding of relevant fire weather phenomena, as well as a look at how tornadoes typically cause damage to forests. Then, we look at the available evidence of three specific cases of extreme wind damage, as well as the background meteorological conditions of 23-24 July 2024.
Part one: Overview of relevant terminology
The first three weeks of July 2024 were hot and dry in Jasper National Park. By the evening of 22 July, when lightning ignited the fires that would eventually merge into the Jasper Wildfire Complex, forest fuels were primed to burn. Over the following two days, the fire grew explosively and generated episodes of extreme fire behaviour that made direct methods of fire suppression impossible (JFDRATT 2025).
According to the National Wildfire Coordination Group glossary of wildland fire terminology (Potter and Werth 2016), extreme fire behaviour typically includes one or more of the following characteristics:
High rate of fire spread
Prolific crowning and/or spotting
The presence of fire whirls
A strong convection column
Reports indicate that all of these were observed with the Jasper wildfire during our period of investigation. However, of particular interest to the discussion of whether true tornadoes occurred was the presence of both strong, deep convection columns and evidence of intense, vortex-generated wind damage.
While official reports don't explicitly mention tornadoes as the direct cause of wind damage in these events, evidence of rotational patterns of tree damage were noted (Canada Wildfire 2025b). Winds of over 200 km/h were estimated near the main smoke column during the afternoon of 24 July, along with wind damage elsewhere that was noted to be consistent with tornadoes of EF4-5 intensity. Significant, "plume-driven" activity was also observed throughout the period, which were associated with "tornado-force" fire-generated winds during the afternoon of 24 July (JFDRATT 2025).
What is a tornado, and how does it form?
According to Environment and Climate Change Canada's weather and meteorology glossary, a tornado is defined as "a violently rotating column of air that extends from a cumuliform cloud to the surface." At the surface, winds are strong enough to be damaging, which tend to be evidenced by rotating dust, debris, or a spray ring over water (Environment and Climate Change Canada 2025).
The study of tornadoes is still an emerging field in atmospheric science, and most of what we know about them and how they form comes from research, observations, and modelling studies of tornadoes in thunderstorms. In general, all tornadoes need two main ingredients to form: a source of rotating air near the surface, and a source of strong vertical motion in the atmosphere, or "lift", that acts to stretch and intensify that rotation to tornado strength (Wakimoto and Wilson 1989). As that rotation is vertically stretched, it contracts horizontally - and like a figure skater pulling in their arms during a spin, it begins to rotate faster due to the conservation of angular momentum.
It's been found that the formation of tornadoes, known as "tornadogenesis", can come about in different ways. In the field of severe convective storms, this is typically narrowed down into two general genesis mechanisms: supercell tornadogenesis, and nonsupercell tornadogenesis.
A supercell is a thunderstorm with a rotating updraft, called a mesocyclone. Supercells also possess coexisting downdrafts that interact with the updraft (Davies-Jones 2015), and are important for creating the necessary rotation near the ground that can spin up into a tornado (Markowski and Richardson 2009). Strong wind shear in the lower atmosphere can cause the mesocyclone in the lower part of the storm to become very strong, providing intense lift that can stretch near-ground rotation to tornado strength (Markowski and Richardson 2014). These unique processes are why the majority of the world's strong (EF2-3) to violent (EF4-5) tornadoes occur with supercell thunderstorms (Davies-Jones 2015).
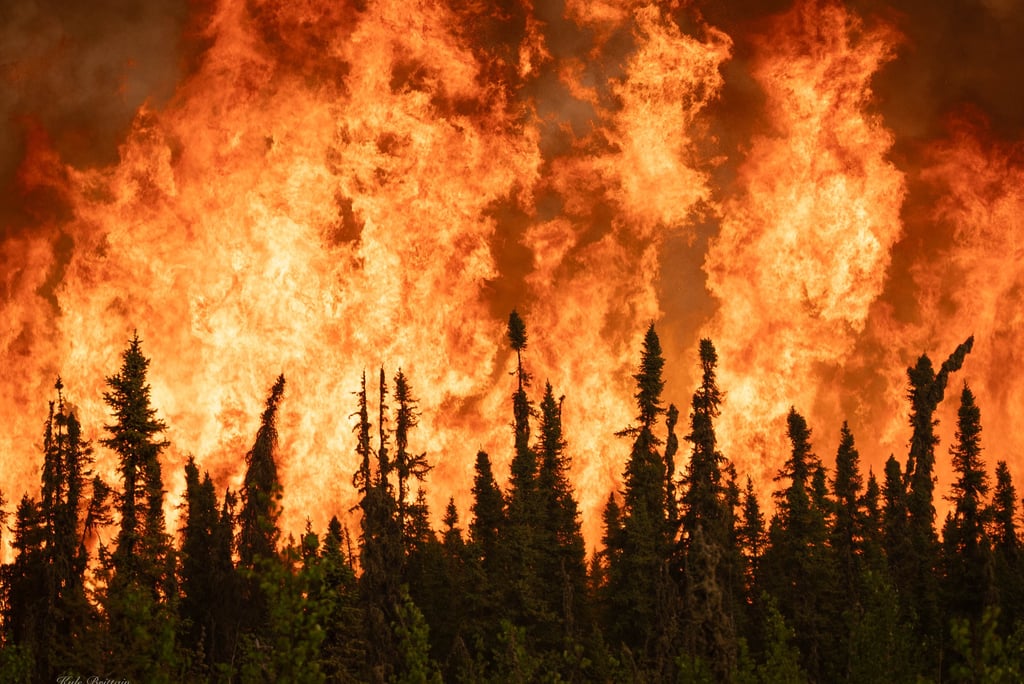
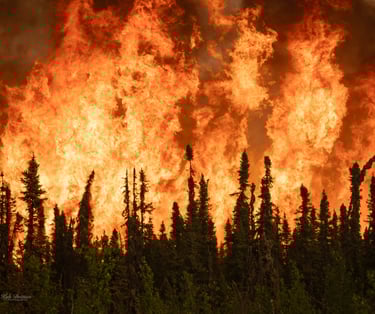
Figure 1: A crown fire is an example of extreme fire behaviour, which occurs when the "crown", or upper canopy of the forest, is involved in high-intensity fire. Image shot by Kyle Brittain near Utikuma Lake, Alberta on 29 May 2025.
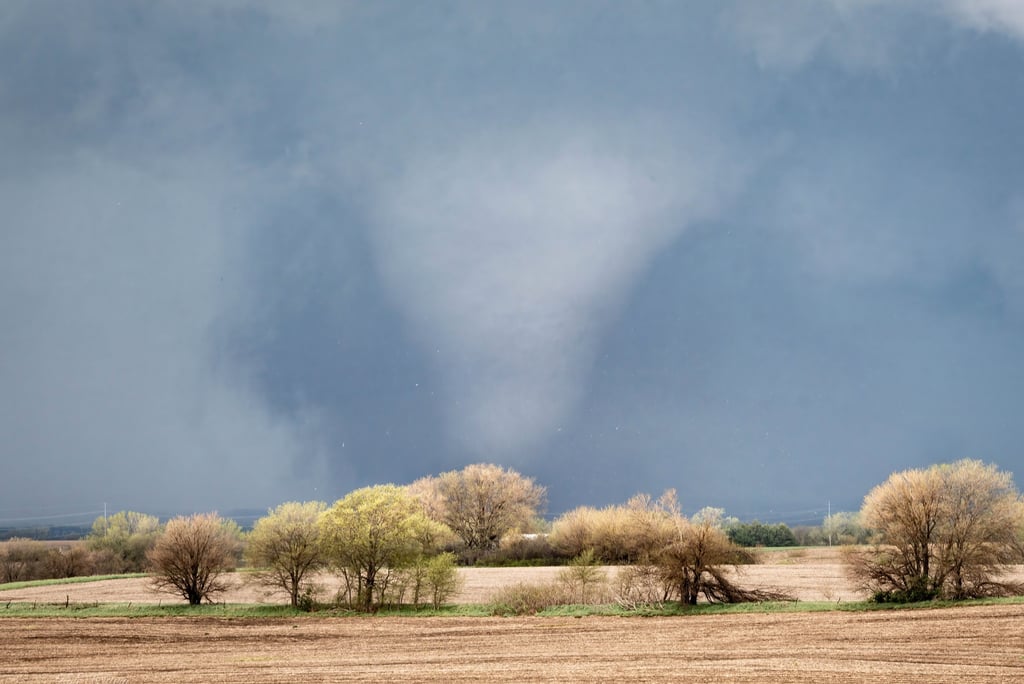
Figure 2: A supercell tornado causes EF3 damage near Lincoln, Nebraska on 26 April 2024. Photo by Kyle Brittain.
Any tornado that does not form by the supercell process noted above is a nonsupercell tornado. One of the main ways this occurs is when winds in the lower atmosphere converge from different directions, creating pockets of low level rotation. Then, should rapidly growing cumuliform clouds develop above these, they can act to stretch the rotation to tornado strength (Wakimoto and Wilson 1989). Therefore, unlike the supercell process, which requires downdrafts for tornadogenesis, these type of tornadoes commonly develop when the parent cloud is still largely dominated by (non-rotating) updrafts.
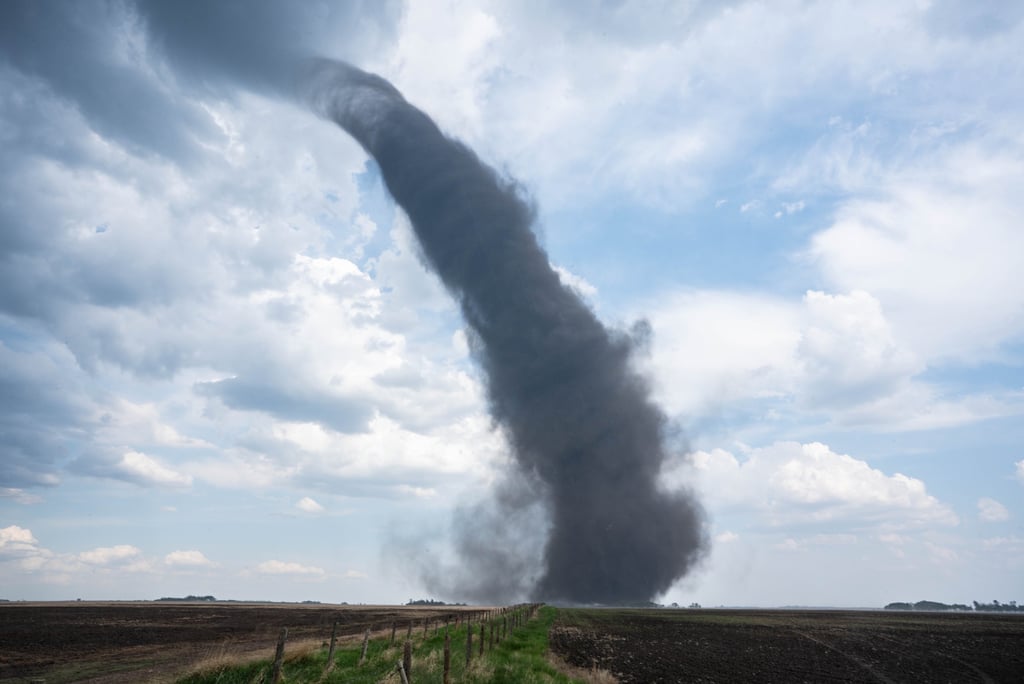
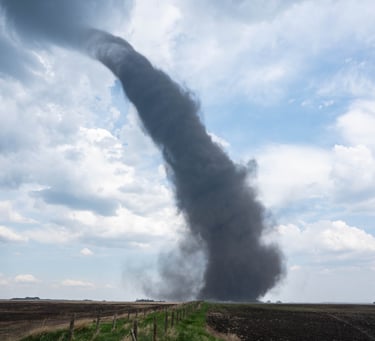
Figure 3: A nonsupercell tornado, rated EF0, kicks up dust over a field near Stettler, Alberta on 31 May 2023. This type of tornado is sometimes called a "landspout", given its similarity in genesis and appearance to its "fair-weather", water-based cousin, the waterspout. Photo by Kyle Brittain.
Tornadoes are among the strongest of a spectrum of vortices that can develop in the atmosphere, from transient dust devils in a parking lot at the lower end to long-lived and violent supercell tornadoes at the high end. But another subset of vortices, called fire whirls, can also develop in association with wildfires. Some of the strongest of these can also be considered true tornadoes.
What are fire whirls?
A fire whirl is any vortex that develops associated with a wildfire - though not all have an inner core of flame. These vortices also span a wide spectrum, from transient, dust devil-scale fire whirls to intense, deadly whirls up to 3 km in diameter. Smaller fire whirls are more common, while larger, destructive whirls are less so (Forthofer and Goodrick 2016).
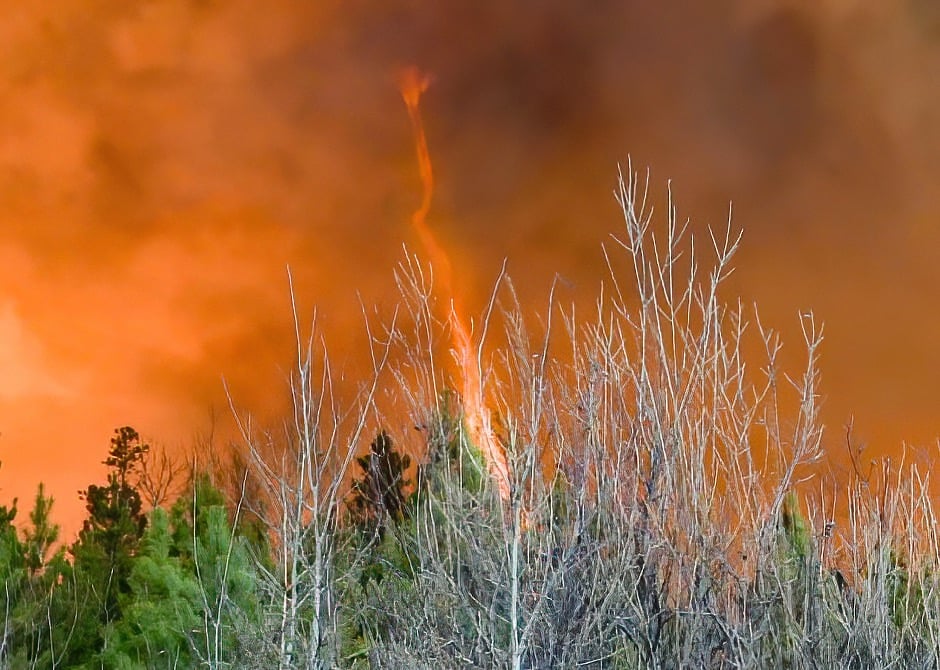
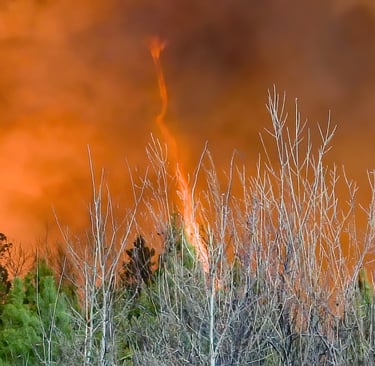
Figure 4: A transient fire whirl, about the size of a large dust devil, forms along the perimeter of a wildfire southeast of Edson, Alberta on 5 May 2023. Screenshot of a video filmed by Kyle Brittain.
The source of rotation, or "vorticity" that makes up a fire whirl can arise in a number of ways. This commonly involves the interaction between background winds and some kind of obstruction, such as a terrain feature or the fire itself. Therefore, this vorticity often forms in the turbulent wake, or lee of mountains, hills, or intense fire plumes - especially when winds are of an optimal speed and direction. Even the geometry of the fireline itself relative to a background, "crossflow" wind can result in areas of vorticity - such as near an L-shaped heat source (Forthofer and Goodrick 2016).
The intense heat release of a wildfire can cause rapid stretching of this near-surface vorticity to tornado strength, with the strongest vortices being capable of winds that can produce significant damage. However, in keeping with the currently accepted definition of a "tornado" (Agee 2014), a fire whirl is only considered a true tornado when being directly driven by both the wildfire and the presence of deep, cumuliform clouds above (Lareau et al. 2018). In the fire weather world, this often involves the formidable pyrocumulonimbus cloud.
The pyrocumulonimbus: A fire-generated thunderstorm
Pyrocumulonimbus clouds, or pyroCb, are fire-generated thunderstorms. In order to be considered a pyroCb, the cloud is typically ice-capped, with satellite-detected infrared brightness temperatures of -38°C or colder (Peterson et al. 2017). This implies that the cloud is often tall, or "deep" enough for ample charge separation to generate lightning.
Like regular thunderstorms, pyroCbs can produce other hazards, such as hail, downburst winds, and tornadoes. However, unlike regular thunderstorms, the highly-polluted nature of these fire-generated clouds causes them to be highly inefficient precipitation producers, making heavy rainfall rare. This is due to the abundance of smoke particles that act as cloud condensation nuclei, compared with the relative lack of water droplets in the cloud upon which they can condense. This can cause pyroCb updrafts to be especially strong as a result of the lack of precipitation drag inside the cloud (Fromm et al. 2022).
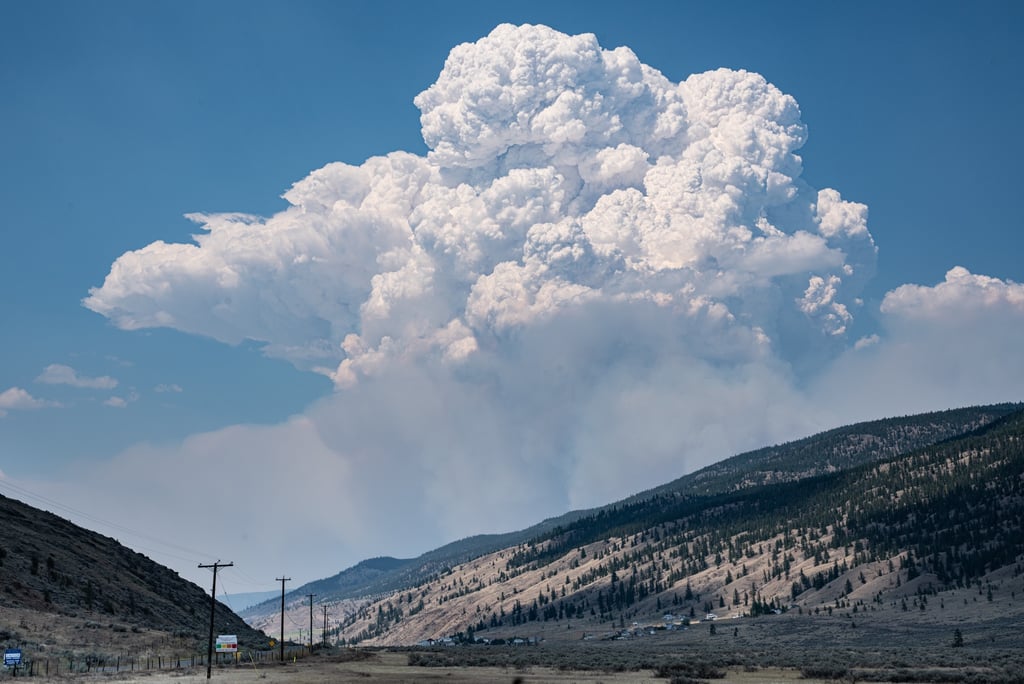
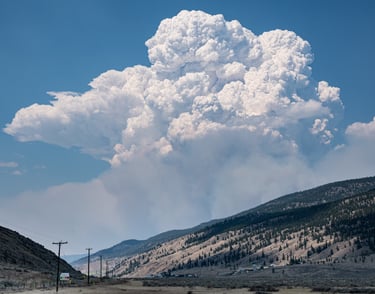
Figure 5: A monstrous pyroCb billows atop the Sparks Lake Wildfire in southern British Columbia on 30 June 2021. Notice the transition from darker smoke to brighter, condensed cloud higher in the atmosphere. Photo by Kyle Brittain.
PyroCbs are favoured to develop when a specific set of meteorological conditions are present. The lower atmosphere is typically hot, dry, and unstable - with gusty winds often present. Aloft, an approaching upper disturbance leads to cooling and moistening of the mid and upper levels of the atmosphere. These conditions, combined with dry forest fuels, can lead to intense wildfire activity at the surface that causes an extremely buoyant plume of air to rise high into the atmosphere. As moisture in the mid-levels of the atmosphere is entrained into the rising smoke plume, the condensation of cloud into pyrocumulus (pyroCu) begins to occur (Peterson et al. 2017).
The heat generated by intense wildfire activity causes the initial boost of vertical motion in the lower atmosphere above the fire. As pyroCu grows into pyroCb above, it reinforces this lift through a much deeper layer of the atmosphere as latent heat is released by the condensation of deep convective clouds. The resulting updraft velocities can be enormous, approaching 60 m/s in the strongest cases, rivalling those of the strongest supercell thunderstorms on Earth (Rodriguez et al. 2020). Such vertical velocities create an environment in which intense, fire-generated tornadoes can develop (Forthofer and Goodrick 2016).
Fire-generated tornadoes
True, fire-generated tornadoes are rare, with only a few documented to date. One such case occurred at Gun Lake, British Columbia during the early morning hours of 18 August 2023, which was Canada's first ever confirmed fire-generated tornado (Northern Tornadoes Project 2023). The National Weather Service issued its first ever fire-generated tornado warning for a large, fire-generated vortex on 15 August 2020 on the Loyalton Fire in northeastern California (Cappucci 2020), and the Canberra Firestorm of 2003 in Australia generated a tornado that produced up to F2 damage over a 20 km track. Other fire-generated vortices of up to EF2-3 intensity have been documented on the 2018 Carr Fire in California (Lareau et al. 2018) and on the 2020 Bear and Creek Fires in California, which have also been investigated as potential tornadoes (Lareau et al. 2022).
There is some debate as to what truly qualifies as a fire-generated tornado. Does the vortex have to be pendant to or reach above the condensation level of the parent pyroCu to be considered a tornado, or merely be dynamically linked to and driven by the growth of deep convective clouds above, which is also an accepted definition by some (Lareau et al. 2018)? This question will also be important for this investigation.
Studies of fire-generated tornadic vortices (FGTV), so named by Lareau et al. (2022), have shown that there tend to be two main types observed, based on their mechanism of formation. The first type are embedded vortices, which are anchored to the fire and exist within its main convection column. These have often been found to occur within the anticyclonic vortex of a counter-rotating vortex pair, which forms when winds of an optimal speed blow past the main fire plume - a case that may have occurred in the Jasper Fire, as will soon be investigated. The second type of FGTV are shedded vortices, which detach and move away from the fire. Video evidence of the Gun Lake fire in British Columbia suggests the event may have been an example of this type of FGTV. Given their direct link to deep convection above, and the near-ground rotation that is vertically stretched to tornado strength, fire-generated tornadoes essentially form by the nonsupercell tornadogenesis process discussed above (Lareau et al. 2018).
In most documented cases, the development of intense fire-generated vortices seems to be optimized when the lower atmosphere is unstable, wildfire activity is intense, and ambient winds are relatively light. Winds that are too strong tend to suppress the development of these vortices. In fact, one study that documented the development of large vortices on prescribed burns in northern Ontario found that their development was suppressed when ambient wind speeds were greater than only 10 km/h (McRae and Flannigan 1990).
How tornadoes cause damage to forests
Tornado intensity is estimated by the Enhanced Fujita (EF) scale. The scale begins at EF0 (with minimum wind speeds of 90 km/h) and peaks at EF5 (with minimum winds of 315 km/h or higher). It contains a series of "damage indicators", such as buildings - which are further broken down by their respective "degrees of damage". Tornadoes are then rated based on reliable evidence of the most severe damage that they cause. Canada's current iteration of the EF scale has 31 damage indicators (Northern Tornadoes Project 2025).
The scale is imperfect, however, as tornado intensity can only be estimated by the maximum damage it causes. Therefore, an intense tornado with EF5 wind speeds will receive a default rating of EF0 if it stays over open fields and doesn't hit anything. Moreover, the current set of damage indicators doesn't include every kind of damage a tornado can inflict. Still, the scale continues to improve over time as our understanding improves of how tornado-force winds cause damage to various objects across the landscape.
Wind-induced treefall damage is one such frontier where our understanding is continuing to improve. For instance, we can differentiate between vortex-generated wind damage (like tornadoes) versus the straight-line wind damage that might be caused by a convective downburst. Tornadoes tend to create long, narrow swaths of damage, with treefall showing characteristic patterns of convergence and rotation, and a tight damage gradient along the edge of the tornado's track. Straight-line winds on the other hand, tend to cause more uniform tree damage over broader areas, with trees laid out neatly in a given direction (Mansour et al. 2021).
The direction that trees fall relative to the tornado's forward motion can also potentially tell us about tornado intensity. This occurs as a result of the relationship between a tornado's translational velocity (forward motion) and its rotational velocity. Tornadoes of EF0-3 intensity tend to have a relatively greater translational velocity, causing patterns of forward convergence. Violent (EF4-5) tornadoes, on the other hand, have been found to cause patterns of backward convergence (Rhee et al. 2021).
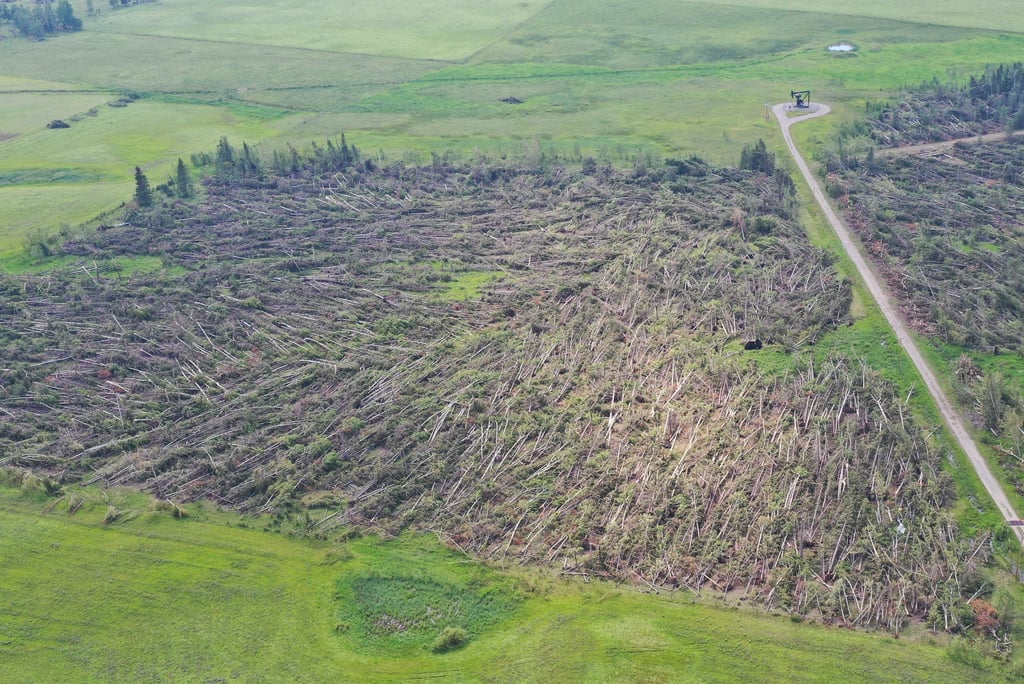
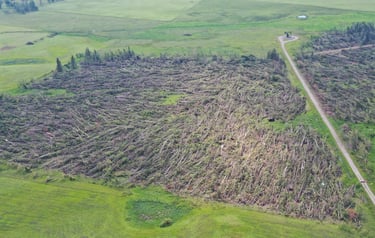
Figure 6: Treefall associated with an EF2-rated tornado near Bergen, Alberta on 7 July 2022. Note where the treefall meets in a convergent pattern from bottom left to top right, indicating the vortex centre-line. The tornado's forward motion was into the page, meaning the observed damage is an example of forward convergence. Photo by Kyle Brittain.
The Northern Tornadoes Project is a team of meteorologists and wind engineers whose aim is to document the occurrence of every tornado in Canada. When possible, they send teams of investigators across the country to document the damage caused by tornadoes and extreme wind events, enabling them to collect high-resolution imagery and conduct quality research on various metrics of wind damage. Elsewhere, the use of high-resolution satellite imagery has enabled them to detect tornadoes in remote, forested areas that would likely not have been otherwise documented (Sills et al. 2020). The process has been further streamlined by new machine learning approaches that make the work of finding tornadic tree fall damage less time-consuming (Butt et al. 2024).
Their work has improved our ability to estimate tornado intensity in patterns of treefall damage, which is one of the official damage indicators in the EF Scale (see page 17 and Appendix B). The degree of damage that a tornado causes is determined by the percentage of trees damaged or uprooted in its track, from which the tornado earns a rating. For instance, tornadoes are typically rated EF2 if more than 80% of mature trees are snapped or uprooted in a portion of the tornado's track (Butt et al. 2025).
However, it is still possible that tornado intensity will be underestimated based on the assessment of treefall damage, as the maximum rating tornadoes can receive from this damage indicator is EF3. In most cases, the maximum rating given based on treefall damage alone is EF2 - especially in the Canadian Shield region, where soil is shallow and trees can topple more easily (Butt et al. 2024).
Part two: Three cases of vortex-generated wind damage in Jasper National Park
Three cases of intense vortex-generated wind damage are presented, with each analysis including images of damage, links to additional photo and video evidence where available, a breakdown of the meteorological environment, and a brief discussion.
Aerial photos are used with permission from the Northern Tornadoes Project and Parks Canada. For each of the aerial images, a coarse hand analysis has also been done by annotating vectors that align with the direction of treefall. This makes it easier to visualize the track of the responsible vortices, and is based on a general technique outlined in Butt et al. (2025). Additionally, high-resolution satellite imagery from Sentinel-2 via the Copernicus Browser will be presented, annotated where necessary, and used to estimate track length and width of the vortex-generated damage. Satellite-detected hotspot data will be presented from FIRMS.
The meteorological analyses will rely heavily on archived visible and infrared satellite imagery from weather.us, as well as ERA5 reanalysis soundings from rawinsonde.com. The representative location selected for the reanalysis soundings was at 52.75°W and 118°W - which lies at an elevation of approximately 1300 metres above sea level, and exists very near to where some of the most impressive vortex-generated treefall damage occurred. Because this ERA5 reanalysis data is based on a coarse, 0.25° x 0.25° grid, and that the selected location exists in complex terrain, reanalysis soundings begin at a grid cell elevation of 1883 metres above sea level. Therefore, while the upper portions of the boundary layer over the Athabasca Valley are generally being represented in reanalysis soundings, the characteristics of the mid and upper troposphere will be of greatest focus.
Overview of the general background meteorological environment
The period of interest that will be examined occurred between the afternoon of 23 July and the evening of 24 July 2024. Therefore, surface and upper air analyses from the morning of 24 July are taken to be representative of the general, large-scale meteorological environment throughout the period.
The 500mb height analysis from 24 July at 12Z (6AM MDT), as seen in figure 7, reveals a prominent upper level low centered along the British Columbia coast near Haida Gwaii, which was a feature that drove several important processes during these wind events. The upper low moved slowly inland and toward the southeast throughout the period, bringing a moderate southwesterly mid and upper-level jet stream over Jasper National Park. It would also act to cause large scale rising air and cooling aloft as it approached, priming the environment for deep convection - with several smaller embedded disturbances travelling through the flow.
At the surface, as seen in figure 8, there was evidence of lee trough development east of the Rockies over Alberta, with a weak low lying over southeastern Alberta and southwestern Saskatchewan. The surface pressure gradient over western Alberta was quite weak, resulting in relatively light winds. Surface observations from three weather stations in the Jasper area confirm light surface winds throughout the period, with maximum winds speeds recorded at no higher than 13.9 km/h on 24 July. This information can be found in Table 2 on page 14 of the Natural Resources Canada (NRCan) report (JFDRATT 2025).
Meanwhile, forest fuels had become extremely dry following weeks of hot, dry weather. Figure 5B on page 11 of the NRCan report reveals extreme build-up index (BUI) values (JFDRATT 2025), meaning fuels were extremely dry to a significant depth, and capable of intense burning.
These fuel characteristics, combined with light low level winds and atmospheric conditions supportive of intense burning and deep convective columns, led to the frequent plume-dominated wildfire activity that was observed during the period. A plume-dominated fire is one where horizontal winds have little influence on fire spread, causing the smoke plume to appear to rise vertically above the fire (Potter 2016). This is in contrast with "wind-driven" wildfires, whose rate of spread is driven by high ambient wind speeds. Plume-dominated fires can nonetheless be associated with extreme fire behaviour, influencing the surrounding environment around them to the point that the fire draws intense winds called "indrafts" toward itself (Peterson et al. 2017). This type of wildfire behaviour, as mentioned previously, is also favourable for the development of intense, fire-generated vortices.
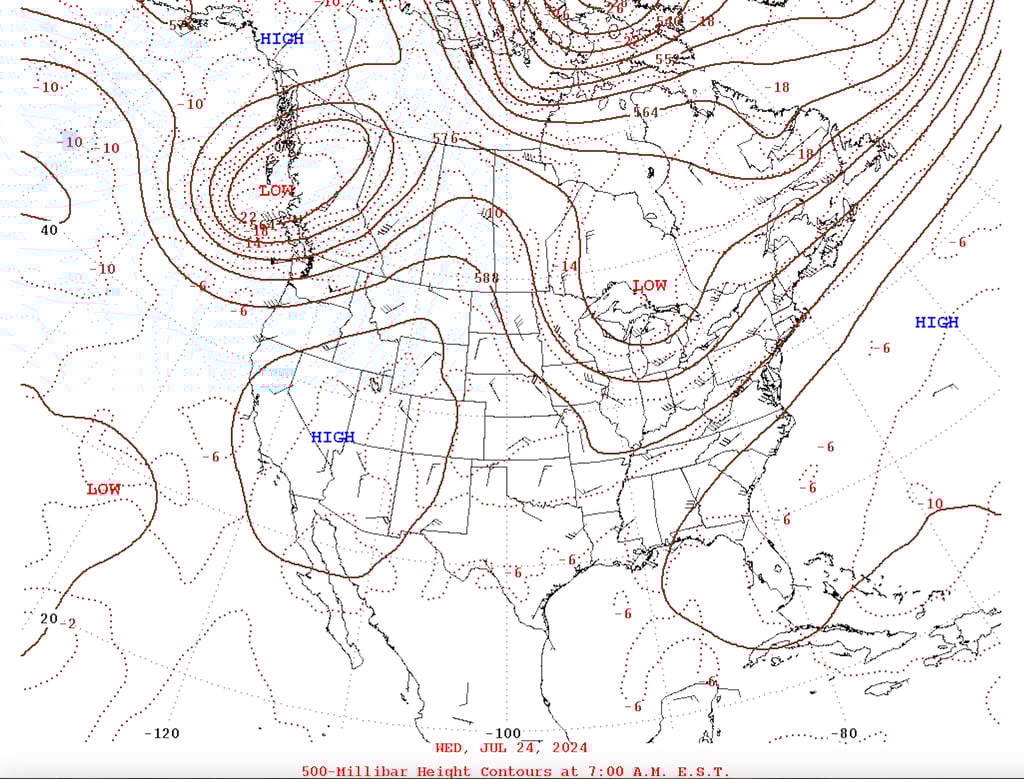
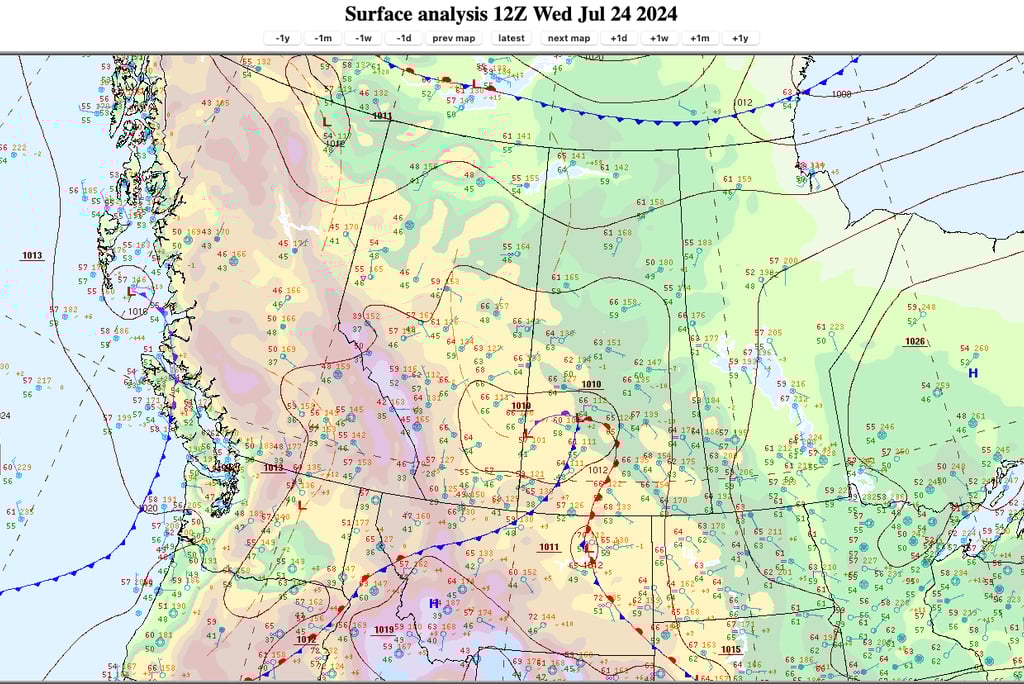
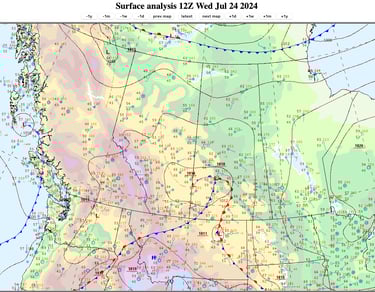
Figure 7: 500mb analysis of height and winds at 12Z (6AM MDT) on 24 July 2024. Note the prominent upper-level, closed low along the British Columbia coast. Credit: NOAA.
Figure 8: Surface analysis showing station plots, mean sea level pressure contours, and fronts at 12Z (6AM MDT) on 24 July 2024. Credit: NOAA.
Cases A, B, and C
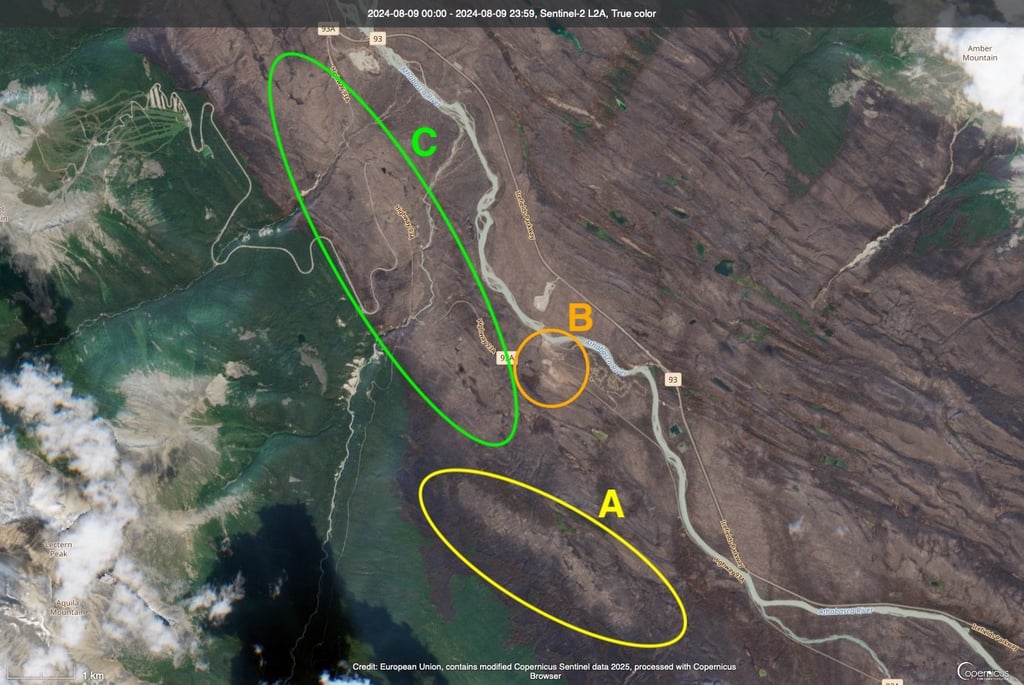

Figure 9: The three cases of extreme vortex-generated wind damage that will be documented, as seen on Sentinel-2 true colour imagery, captured on 9 August 2024. Credit: Copernicus.
Figure 9 shows the three areas of Jasper National Park where extreme wind damage occurred. The Wabasso Campground lies near the center of this image, part of which was directly impacted by the vortex from Case B. Given northward progression of the fire, along with other evidence that suggests the timing of these events, they have been ordered alphabetically according to their likely time of occurrence. The original image without annotation can be viewed here.
Case A
Date and Time: Available evidence suggests this event occurred sometime between 4PM MDT on 23 July and 4AM MDT on 24 July
Estimated track length and width: Approximately 3.3 km long and 350 m wide
Visual photo or video evidence of vortex: None
Evidence of damage:
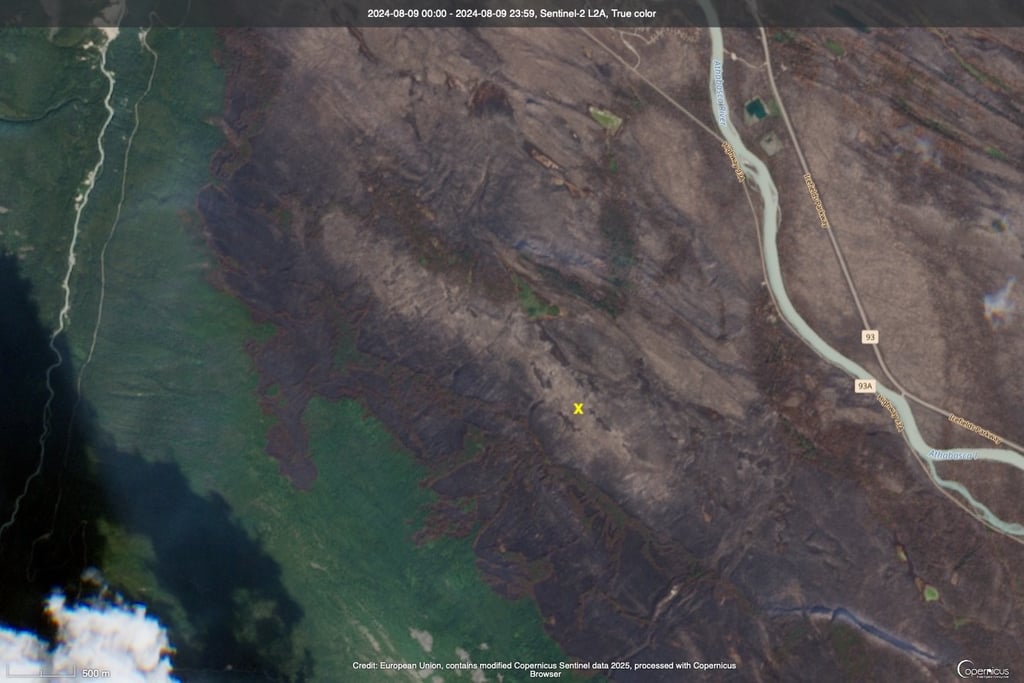

Figure 10: Note the lighter-coloured damage swath as seen on Sentinel-2 true colour imagery, captured on 9 August 2024. Credit: The yellow "X" marks the approximate location from which figures 11 and 12 were captured. Credit: Copernicus.
This event marks the most impressive visual evidence of vortex-generated treefall of all three cases, with a damage swath clearly seen on high-resolution satellite imagery (figure 9). The small yellow "x" in figure 10 marks the location from which the images of figures 11 and 12 were captured below.
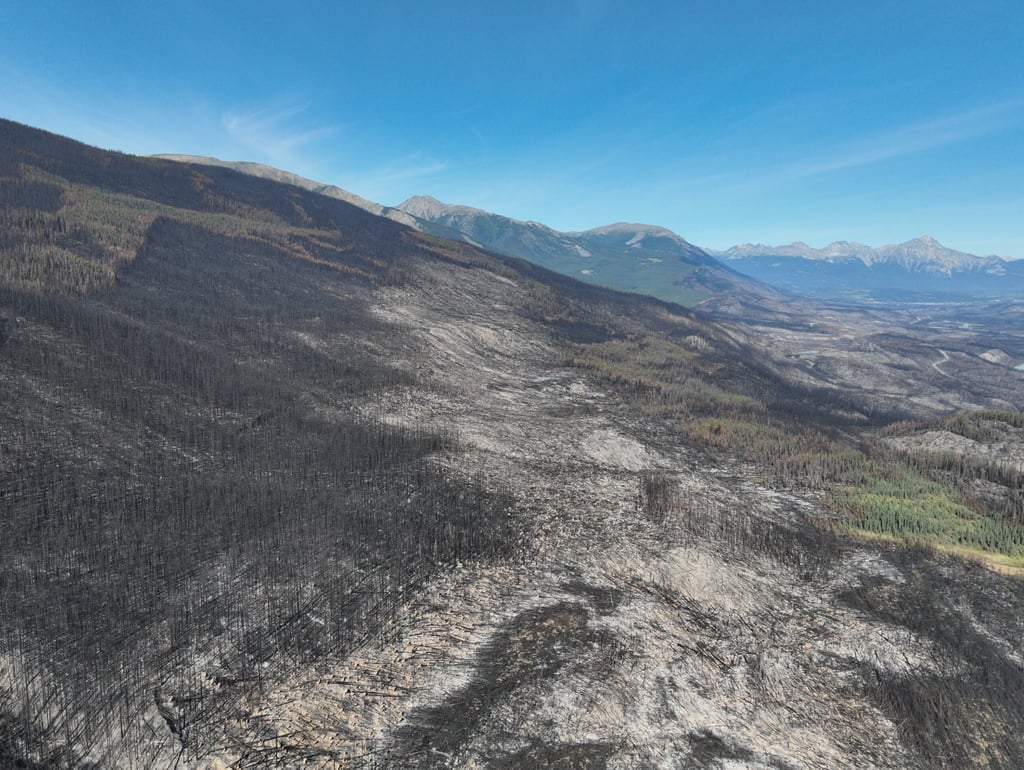
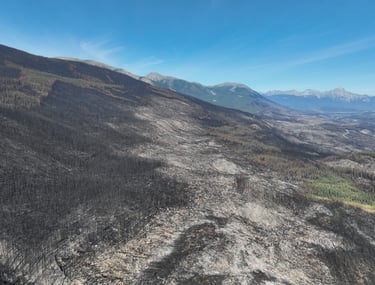
Figure 11 is looking northwest down the path of motion, as the vortex likely ascended the slope from southeast to northwest. A tight damage gradient is observed, consistent with vortex-generated wind damage. Figure 12 reveals a classic example of backward convergence, given motion from southeast to northwest. To see the original image without annotated treefall vectors, click here.
The NRCan report notes some important details that help to narrow down the timeframe for which this event occurred. On page 25, it notes that by 8PM MDT, the fire had reached to within 2 km of the junction between Highway 93A and Edith Cavell Road - though it is unclear what direction from this intersection the fire was observed (JFDRATT 2025). This may be an important detail, since parts of the damage swaths of both Cases A and B occur within this range.
Satellite-indicated hotspot maps, such as those displayed on the FIRMS website, can be a useful tool for helping determine areas of active fire on the ground. However, there are several important factors to consider in using these products effectively - and some of these come into play in the analyses of the events observed in Jasper. Aside from needing clear skies to view the Earth's surface, false detections can occur outside the fire perimeter in certain cases. Examples include when wildfires undergo explosive growth, with deep plume development; when scanned from a high viewing angle; and when scanned at night (NASA Earthdata 2025).
Bearing this in mind, satellite-indicated hotspots were detected within 1 kilometre of the start of Case A's track, based both on the scan of VIIRS NOAA-21 at 3:33PM MDT and MODIS Aqua at 3:56PM, which means the event may have occurred anytime from the late afternoon or early evening onward. However, these comprised the westernmost pixels detected as intense wildfire activity with deep convective columns were ongoing to the east of the area. Therefore, these may not have represented the true location of the fire's western flank - but nonetheless show wildfire activity approaching from the east and southeast.
Between these and the next hotspot scans that occurred during the early morning hours of 24 July, a couple of other important details emerge in the report. Intense fire behaviour was observed to continue well into the evening, with Figure 14C and D on page 26 revealing impressive, convective plumes after 8PM MDT along the eastern side of the Athabasca River valley. Moreover, "large flames" were observed occurring well south of the Jasper townsite until at least 11PM MDT - suggesting intense, plume-dominated fire behaviour persisted well into the late evening (JFDRATT 2025).
Figure 11: Looking NW along the path of motion of the vortex, which ascended the slope northwestward. Photo credit: Northern Tornadoes Project.
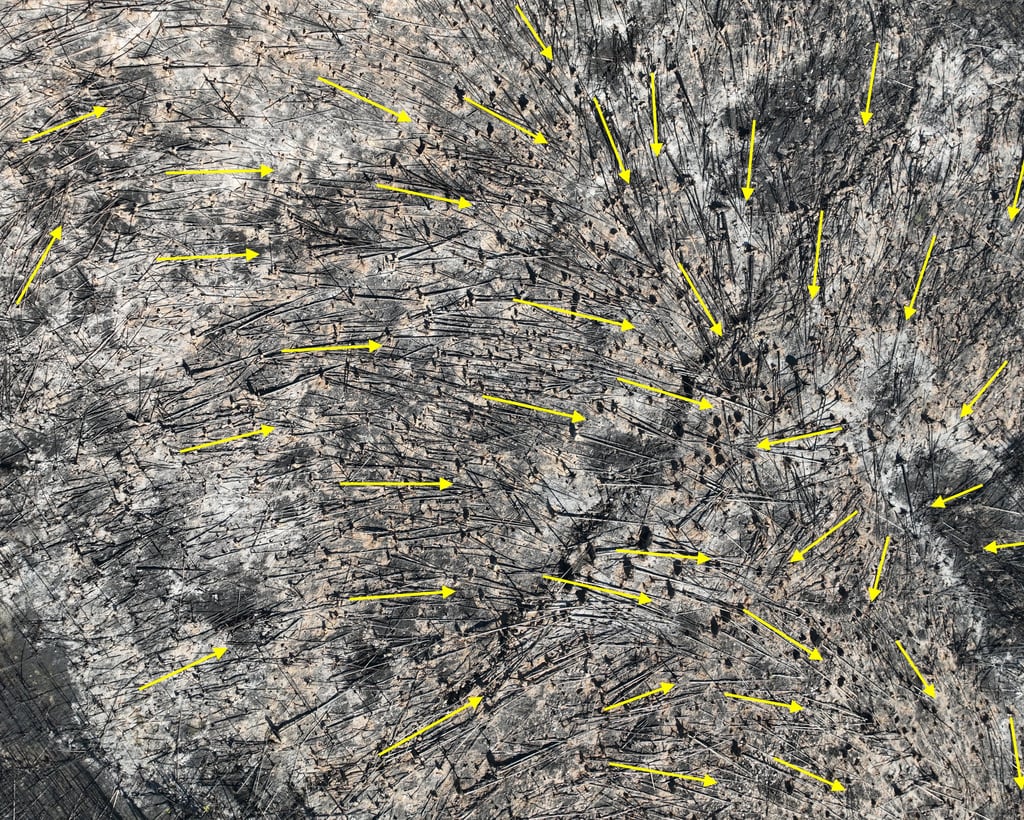
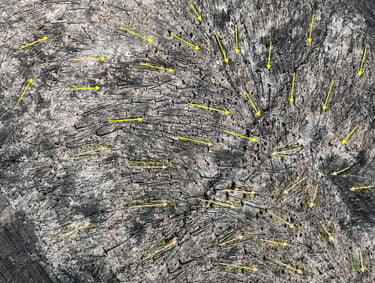
Figure 12: Clear evidence of convergent treefall, revealing vortex-generated damage. Given the likely northwestward motion based on the direction of ambient winds and fire spread, this would be an example of backward convergence. Photo credit: Northern Tornadoes Project; annotation by Kyle Brittain.
Finally, the next hotspot scans from VIIRS NOAA-20 at 2:54AM MDT and NOAA-21 at 3:45AM MDT indicate that the fire had made a significant northwestward excursion toward Edith Cavell Road, which was also noted on page 26 of the report. This area matches closely with the area where Case A's vortex-generated damage swath occurred, suggesting it may have been responsible for the fire's "run" in this area. While the report notes that the excursion may have occurred during the evening of the 23rd (JFDRATT 2025), the presence of numerous false detections to the west of Edith Cavell Road during these scans suggests "hot smoke" may have still been detected above active, intense wildfire activity at the surface during the early morning hours. Nonetheless, given the presence of these detections, the event likely occurred before 3AM MDT.

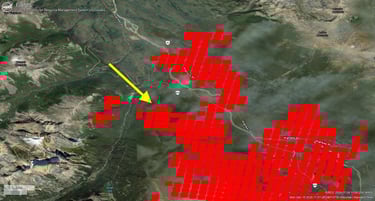
Figure 13: Satellite-indicated hotspots by VIIRS NOAA-21 at 0945Z (3:45AM MDT) on 24 July. The yellow arrow points toward the area of the northwestward excursion. Also note the false detections to the west of the Astoria River valley, where no fire spread occurred in the area. Credit: FIRMS.
Meteorology:
The ERA5 reanalysis sounding is selected for 04Z 24 July (10PM 23 July), at 52.75°N and 118°W - less than a kilometre north of the "dogleg" bend in the vortex damage track of Case A. This time was selected based on the vortex occurring sometime between 4PM and 4AM MDT, when intense fire activity was still being seen south of Jasper townsite amid a time when satellite-indicated deep convection was ongoing.

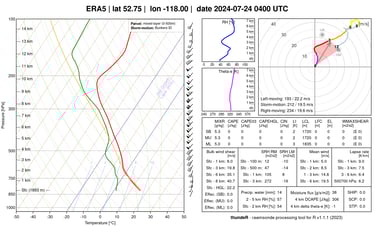
Figure 14: ERA5 reanalysis sounding for 04Z 24 July (10PM MDT 23 July). Credit: rawinsonde.com
Based on reanalysis data, the 04Z (10PM MDT) profile shows evidence of steep low level lapse rates (temperatures cooling quickly with height) to above 700mb, with a convective condensation level (CCL) near 2400 metres. The CCL is estimated by taking the mixed layer lifting condensation level (MLLCL) and correcting it for elevation, as noted in the initial section of Part 2. Additionally, light southerly winds exist in the low levels, with a much stronger southwesterly jet stream aloft. Given a local sunset time of 9:59PM MDT, the earliest signs of the development of a nocturnal inversion are present at valley bottom in the surrounding area.
However, it is the trend in temperature and humidity aloft during this timeframe that reveals an environment increasingly favourable for deep convection. Click this link to see a loop of ERA5 reanalysis soundings from 6PM to 1AM MDT, and note the pronounced cooling aloft occurring in the 700-500 mb layer between 9PM and 12AM MDT - along with a moistening profile through the mid and upper levels of the troposphere. The deep convective columns observed after 8PM MDT and the observed intense fire activity persisting until at least 11PM MDT provide ground truth for this environment, and suggest the ongoing potential for deep pyroconvection, pyroCb development, and fire-generated tornadoes.
Driving the cooling and moistening profile aloft is the gradual approach of the aforementioned upper-level closed low. However, an embedded disturbance passing through the flow during the late evening, as indicated on archived satellite imagery, likely further enhanced the local environment.
Click this link to view the archived visible satellite imagery from 8PM to 930PM MDT on 23 July:
Note the deep pyroCu that erupts over the Jasper fire after 8PM MDT, along with the approaching cloud shield from the southwest. The anvils of ongoing severe thunderstorms are also visible well to the east, along with other smoke plumes in the area.
An important note on satellite parallax: The GOES-16 imagery displayed here is based on a satellite positioned above the Equator at 75.2° W, resulting in parallax effects that cause tall clouds to appear in slightly further away than they actually are on these satellite maps, especially as they grow taller. In the Jasper area, clouds with tops near 15,000 feet will appear about 14 km to the northwest of their actual location in this imagery, while clouds with tops near 30,000 feet will appear about 27 km to the northwest of their actual location.
Associated with an embedded upper disturbance, a notable plume of mid and upper level moisture approached the Jasper National Park during the evening, with cloud cover seen passing over the fire between about 930PM MDT 23 July and 1230AM 24 July. This somewhat obscures any ongoing deep convection over the fire, but important clues are nonetheless present.
Click this link to view the archived infrared satellite imagery from 8PM MDT 23 July to 1AM MDT 24 July.
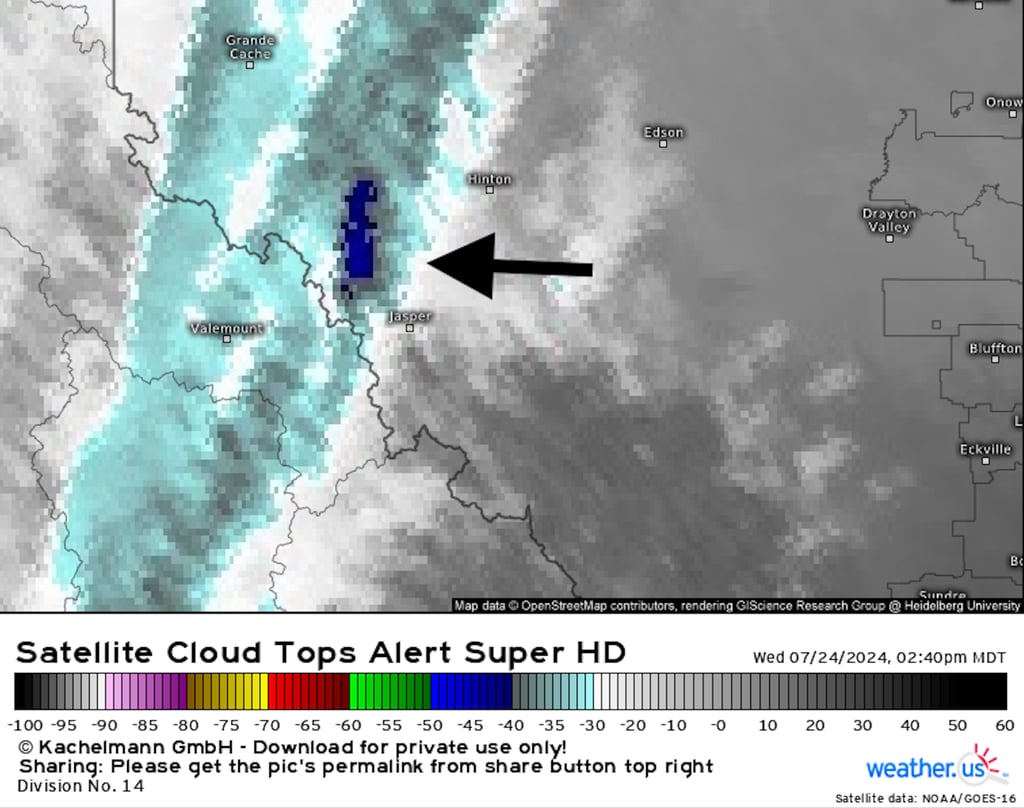
The initial pulse of pyroCu that occurred after 8PM MDT appears with cloud top temperatures near -30°C, indicating cloud top heights near 7 km above the Athabasca River valley, based on the 03Z (9PM MDT) reanalysis profile. At 1040PM MDT, brightness temperatures decrease as a cloud moves over the fire, which may have been tied to a pulse of deep convection at the surface. However, perhaps the most interesting sequence occurs between about 1140PM MDT and 1220AM MDT.
Note the round area of pixels that appear just northwest of Jasper in figure 15 (which appear several kilometres to the northwest of their real location over the Earth due to the effects of parallax). When watching this area around midnight in the infrared satellite loop, a stationary area of cloud top temperatures approaching -40°C appear (revealing cloud tops greater than 7.5 km above valley bottom), relative to the moving surrounding clouds. Since wildfires are relatively stationary features on the landscape, pyroCu and pyroCb above fires tend to also appear stationary relative to surrounding clouds in motion. The feature disappears shortly after the lift and associated cloud shield moves off to the east, which would be consistent with the cessation of an environment favourable for deep, convective clouds.
This feature suggests that the strongest condensed, deep convection may have occurred over the fire during that period of the evening. It may also provide a clue as to when this fire-generated vortex occurred, as the visual indicator of a mechanism strong enough to support a destructive vortex up to 350 metres wide.
Discussion:
Based on the plume-dominated behaviour and deep pyroCu that occurred over parts of the fire after 8PM MDT, and the observed presence of large flames late into the evening that would support continued deep convection - coupled with an environment that grew increasingly favourable for pyroCu and pyroCb development in the evening - it is plausible that the fire-generated vortex damage occurred during a period around midnight, when satellite-indicated deep moist convection occurred. A vortex causing the damage observed over a 350-metre wide swath would require significant lift through a deep layer of the atmosphere, as would be present in deep pyroCu or pyroCb. The lack of ground observations and the obscuring effect of the cloud shield reduce the certainty of the timing of the event, which may otherwise help in its classification. Regardless of the time it occurred, if it was linked to and driven by condensed, deep convection, it could be classified as as a fire-generated tornado.
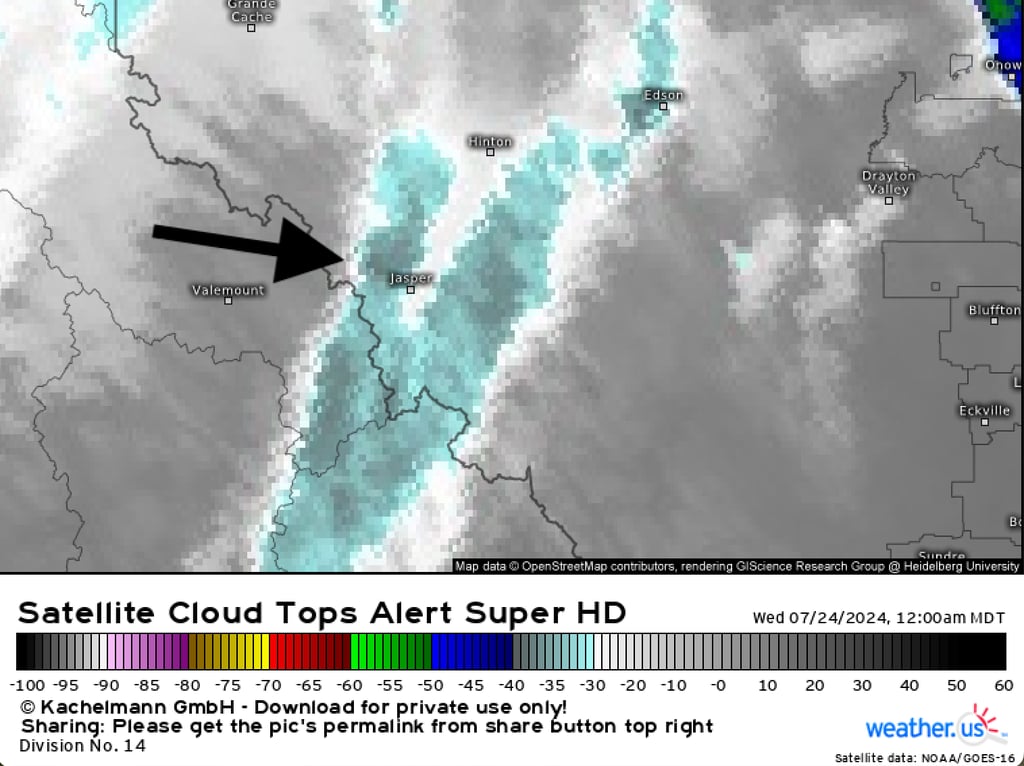

Figure 15: Infrared satellite imagery over Jasper National Park at 12AM MDT 24 July. The black arrow points toward an area of embedded deep convection. Credit: weather.us
Case B
Date and Time: Available evidence suggests this event may have occurred during the early afternoon of 24 July - though the potential window of time may stretch back to late evening on 23 July
Estimated track length and width: Approximately 1.5 km long and up to 600 m wide
Visual photo or video evidence of vortex: None
Evidence of damage:
Perhaps the most significant damage of all three events was documented in Case B, with numerous, impressive examples of damage near the Wabasso Campground suggestive of truly intense wind speeds.
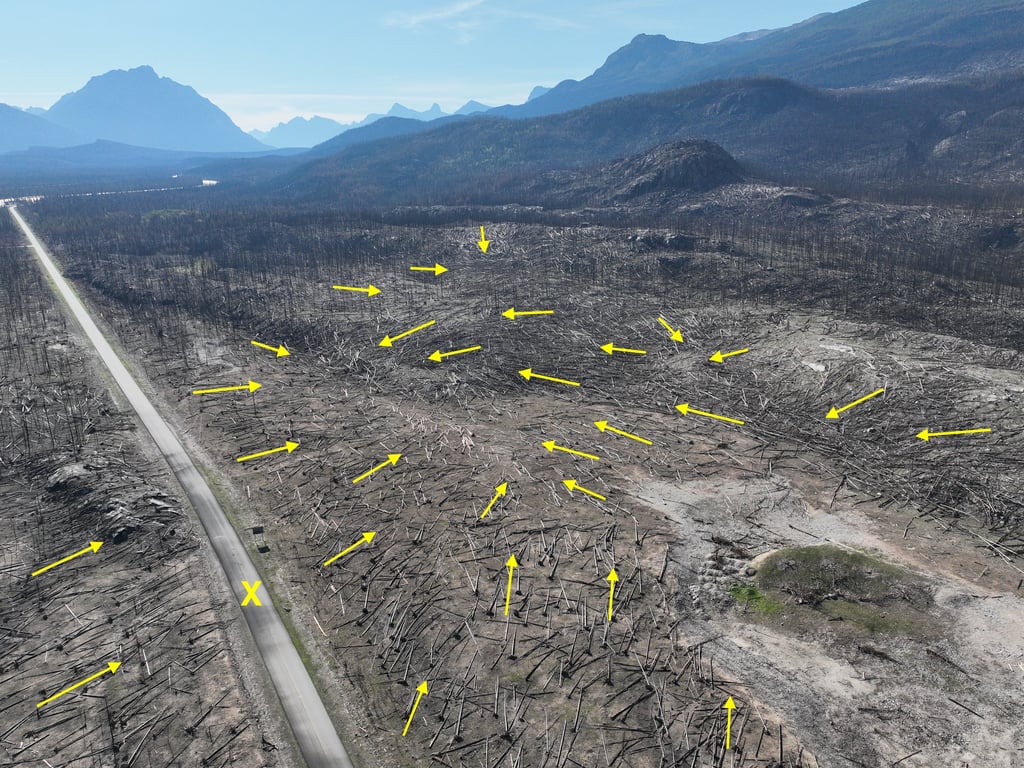
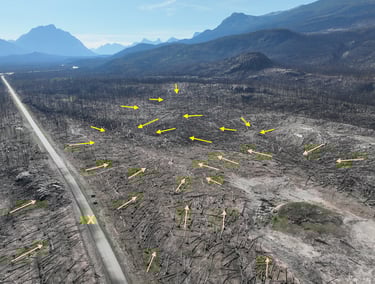
Figure 16: Looking south from the air near the northwest edge of the Wabasso Campground. Given the likely motion north-northeastward, this vortex displays evidence of backward convergence in treefall. The "X" marks the location of figure 19 below. Photo credit: Northern Tornadoes Project; annotation by Kyle Brittain.

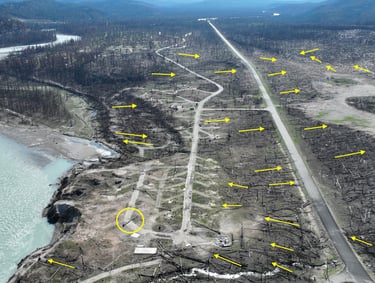
Figure 17: Looking southeast from the air over the Wabasso Campground, captured a little further north than figure 16. The most severe damage was observed near the bottom of the image, in the northwest corner of the campground. The yellow circle is the location of figure 18. Photo credit: Northern Tornadoes Project; annotation by Kyle Brittain.
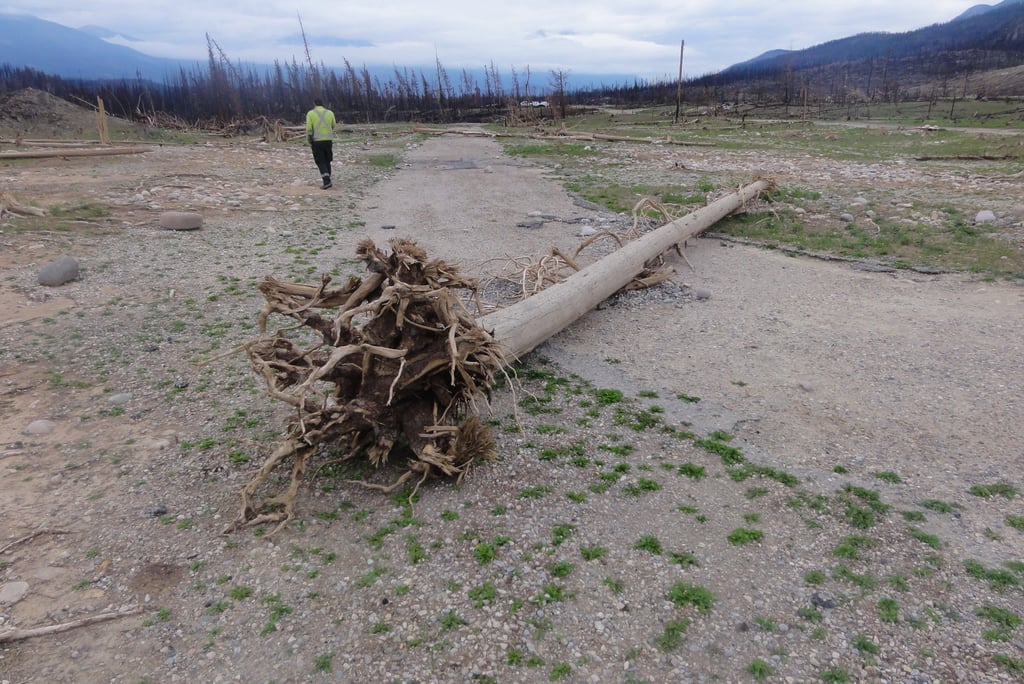
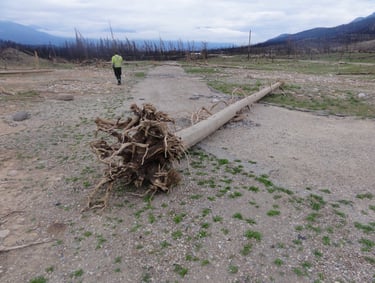
Figure 18: A mature tree lying in the Wabasso Campground that appears to have been debarked, ripped from the ground, and tossed. Beneath the tree, there is near-total scouring of asphalt on the loop road of the campground. Photo credit: Northern Tornadoes Project.
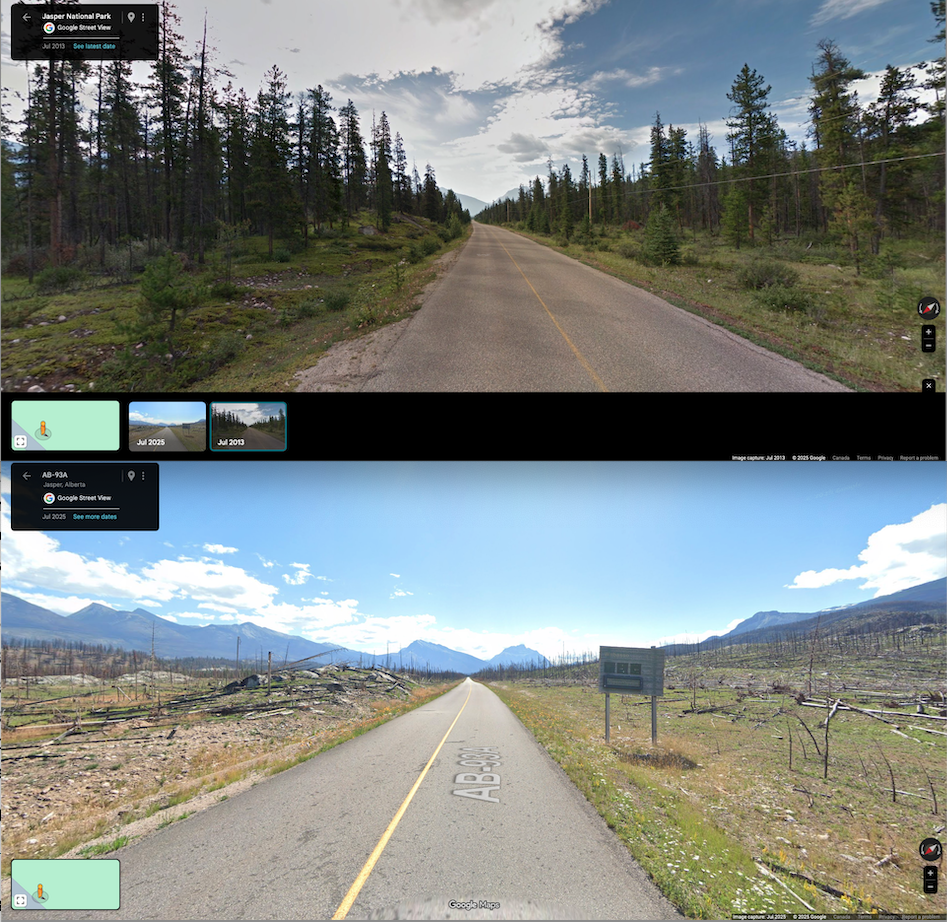
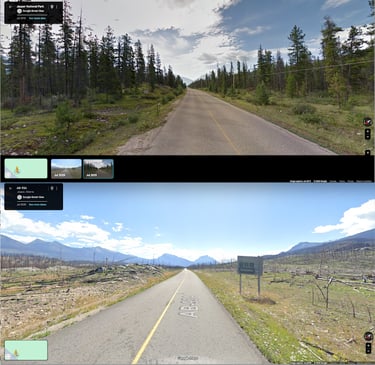
Figure 19a/b: A comparison of the same section of Highway 93A adjacent to the Wabasso Campground, between July 2013 (fig. 19a) and July 2025 (fig. 19b). While the mountain pine beetle infestation largely occurred after the top image was taken, perhaps causing some visible changes to the landscape, the damage is nonetheless striking. Credit: Google Streetview.
This vortex had the shortest track length, but the widest damage swath relative to its length out of all three cases. Treefall patterns are largely convergent, especially near the vortex centreline - however, differential treefall in certain places suggests that some trees may have fallen at different times as the vortex passed by. There is also evidence that large, mature trees were debarked, ripped from the ground, and thrown, as seen in figure 18. Based on treefall analyses, it appears the vortex developed a little over 1 km south of the northwest corner of the Wabasso Campground, before tracking north-northeast and becoming very intense as it crossed Highway 93A (figures 16 and 17).
Click these hyperlinks to view the original images for figure 16, figure 17, figure 19a and figure 19b.
Other evidence of extreme wind speeds included the scouring of the asphalt from the loop road in the northwest corner of the Wabasso Campground (see figure 18). There was also near-total blowdown of trees in this area, most of which were debarked, as can be seen in figure 18D on page 31 of the NRCan report (JFDRATT 2025). Debarking of trees is often caused by flying debris (Stevenson et al. 2023), and is unsurprising in this case given the observation of gravel impacting tree trunks on page 29 of the NRCan report (JFDRATT 2025).
More impressive damage was noted in Canada Wildfire (2025a), from about 1:02:06 onward, including the lofting of bear-proof garbage bins that had been bolted to concrete slabs. Iron fire grates, weighing an estimated 100 pounds, were also ripped from the ground, lofted high into the air, and warped as they hit the ground.
Perhaps the most significant damage indicator observed was the lofting of a 3000 kg shipping container over 100 metres through the air from the Wabasso Campground into the Athabasca River (Canada Wildfire 2025a, JFDRATT 2025). The wind speeds required to loft an object of this size through the air would be extreme, and perhaps on par with the wind speeds occurring in only the strongest tornadoes. The current EF scale does not include large, compact objects as damage indicators. However, Miller et al. (2024) estimated tornadic wind speeds using the trajectories of such objects and found that EF5-strength winds were likely required to loft objects in several tornadoes that were rated lower, including a pickup truck, an SUV, a combine, and hay bales - though the authors noted potential limitations to their approach. Nonetheless, a more in-depth assessment of the damage observed in Jasper National Park would be informative.
Meteorology:
Given the lack of observational evidence of this vortex, we are left to examining the available meteorological evidence for signs of the deep pyroconvection that likely occurred in association with such a violent event. While this may have occurred as the fire perimeter spread toward the area late in the evening of 23 July or early in the morning of 24 July, the most compelling evidence suggests this event may have occurred as the fire suddenly picked up in intensity during the early afternoon of 24 July.
In Canada Wildfire (2025a), a classic fire weather pattern was noted on 24 July, with fire behaviour suddenly ramping up in intensity as the nocturnal inversion eroded near midday. The NRCan report on page 27 noted that this occurred around 12:50PM MDT (JFDRATT 2025). During the noon hour, pyroCu began to develop over the wildfire, as can be seen in the satellite loop at the beginning of this video.
The ERA5 reanalysis sounding from 19Z (1PM MDT) on 24 July (figure 20) reveals steep low level lapse rates to over 700mb, a layer of much drier air above the boundary layer, and higher relative humidity above 500mb. Once again, southwesterly winds are seen to increase with height, with winds immediately above the surrounding ridges at 15-20 knots. The nearest observed upstream sounding from Vernon, British Columbia at 12Z (6AM MDT) on 24 July can be viewed here.
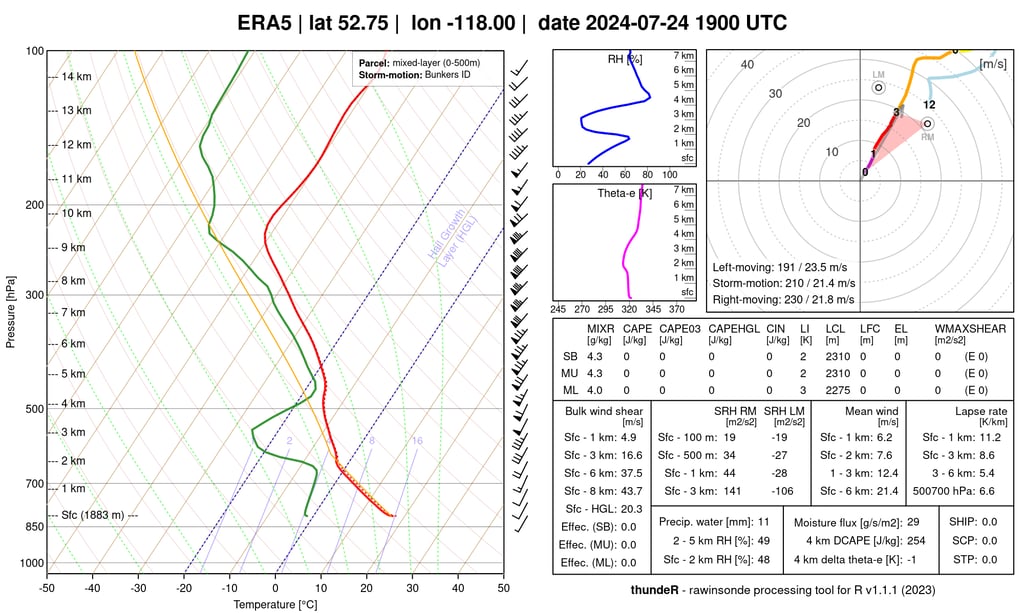
Figure 20: ERA5 reanalysis sounding for 19Z (1PM MDT) 24 July. Credit: rawinsonde.com
Much like the previous evening, the environment grew increasingly favourable for the development of deep pyroCu and pyroCb into the afternoon. Click this link to see the loop of ERA5 reanalysis soundings from 18Z (12PM MDT) 24 July to 00Z 25 July (6PM MDT 24 July):
The influence of upper level lift can be seen in the profile over time, with cooling temperatures aloft - especially in the dry air layer between 700-500mb, destabilizing the profile. The profile also moistens in the mid-levels, which corresponds with the increasing cloud cover observed over Jasper National Park during the afternoon. Any smoke plume that could rise into this moist layer could see the ready development of condensed, deep convective clouds - which was indeed observed on satellite over the following several hours. The 19Z (1PM MDT) CCL exists at just under 3000 m above valley bottom, per the ERA5 reanalysis sounding in figure 20.
Archived visible satellite imagery reveals that deep pyroCu suddenly exploded above the Jasper fire at 140PM MDT (figure 21), signifying a sudden ramping up in wildfire activity at the surface a few minutes earlier. Serendipitously, a photo was captured looking south toward this pyroCu at 141PM, as seen in figure 15B on page 27 of the NRCan report (JFDRATT 2025).

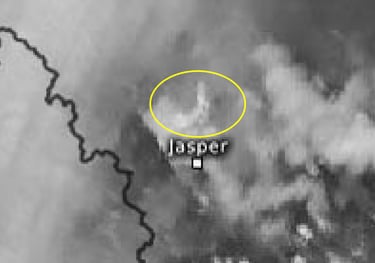
Figure 21: Archived visible satellite imagery at 140PM on 24 July reveals a sudden explosion of deep pyroCu over the Jasper fire, in this zoomed-in view. Credit: weather.us
Click this link to see the visible satellite loop from 12PM MDT to 9PM MDT on 24 July:
Following the development of the initial pyroCu at around 1230PM MDT, note the eruption of deep convective cloud above the Jasper fire at 140PM MDT (figure 21) as the mid and upper level cloud shield approaches the area from the west-southwest. Deep, moist convection also erupts along the foothills to the east around a similar time. Condensed cloud is visible above the fire through the diffuse cloud shield throughout much of the period. Several pyroCb pulses occur above the fire from 5PM MDT onwards, which will be further discussed below.
Though convection is certainly deep, at between 7 and 8 km, it doesn't quite attain pyroCb status based on cloud top temperatures until about 240PM MDT. However, at this time, this signature is likely associated with Case C, which will be discussed below. Click this link to see the loop of infrared brightness temperatures between 12 PM MDT and 9PM MDT on 24 July.
Available evidence from satellite-indicated hotspot maps, as well as the mapped location of the fireline in the NRCan report suggest that some of the first intense fire behaviour on 24 July likely erupted in the vicinity of the Wabasso Campground during the early afternoon. This occurred after the fire slowly crept into the area following the previous evening's burn. Figure 16 on page 28 of the NRCan report indicates that there was a segment of active fireline detected at 203PM MDT near where the Case B vortex began. Moreover, a scan from MODIS - Terra at 1908Z (108PM MDT) indicated hotspots in this same area.
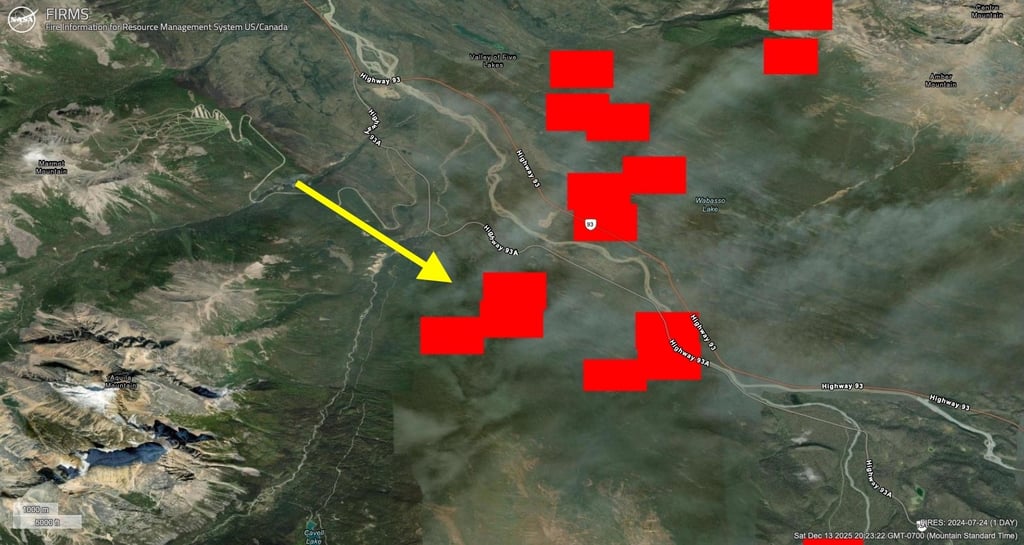
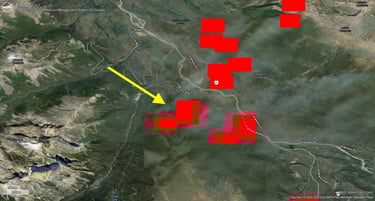
Figure 22: Hot spots detected by the MODIS-Terra satellite at 1908Z (108PM MDT) 24 July. Credit: FIRMS.
Given the unknown time of this event, along with the absence of any visual evidence of its occurrence, the mechanism of formation of the vortex is also unknown. Part of the reason for this could be that intense, fire-generated vortices are often obscured as they occur deep within a smoke plume (McRae and Flannigan 1990). Was it an example of an embedded vortex as part of a counter-rotating vortex pair, as discussed in Lareau et al. (2022)? If so, was it a cyclonic, or anticyclonic? Might it have spun up as a result of interactions within complex fireline geometry, or near a local segment of fireline that acted as an L-shaped heat source, given optimal ambient wind speeds that acted as a crossflow? The latter type of vortex tends to be more stationary, which might explain the short but wide and severe damage observed (Forthofer and Goodrick 2016). The answers to these questions may become clearer should further observational evidence arise surrounding this case.
Discussion:
As in Case A, the lack of available observational evidence as to the timing and appearance of this event make its classification as a fire-generated tornado difficult. However, the available evidence of the fire's location relative to the area of damage suggests this event occurred during the early afternoon of 24 July, as fire behaviour initially ramped up. This occurred as the environment was rapidly becoming increasingly favourable for the development of deep pyroCu and pyroCb, which abruptly began after 130PM MDT. The occurrence of fire-generated tornadoes may be especially favoured just as pyroCb development commences above the fire, owing to the sudden, intense lift generated by the latent heat of condensation that can serve to stretch vorticity to tornado strength (Lareau et al. 2018). Therefore, the presence deep pyroCu, either intensifying or itself caused by a strong fire-generated vortex, may be a sign that a fire-generated tornado occurred just after 130PM MDT. This would certainly seem to be plausible, given the severity of the damage that occurred over a wide area in Case B.
Case C
Date and Time: Between approximately 2-3PM MDT on 24 July, and perhaps longer
Estimated track length and width: Approximately 8 km long and 1.5 km wide
Visual photo or video evidence of vortex:
Unlike Cases A and B, there is plentiful photo and video evidence for Case C, which appeared as a large and ominous smoke plume that was rotating in an anticyclonic (clockwise) manner. See figure 17 on page 30 of the NRCan report, which has several images of the rotating smoke plume (JFDRATT 2025). There is also excellent video footage in Canada Wildfire (2025a), between 25:37 and 30:18.
Evidence of damage:
Of all three cases, Case C presented with the most widespread treefall damage, having the longest and widest damage swath.

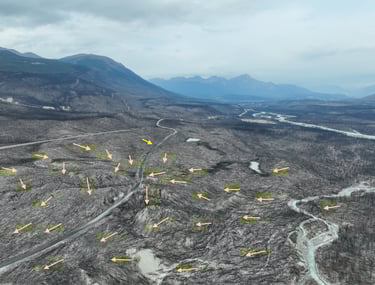
Figure 23: An aerial image shot from about 1.5 km southeast of the intersection of Highway 93A and Marmot Road, looking northwest along the damage swath. Image credit: Parks Canada; annotation by Kyle Brittain.
As observed from both aerial photography and high-resolution satellite imagery, this damage swath is broader, with a gentler damage gradient along its edges. Treefall patterns have some evidence convergence, as seen in figure 23, but also more complex blowdown patterns within the overall swath. This may suggest that the plume-generated indraft winds alone were sufficient to cause much of the widespread blowdown. It is also possible that one or more embedded vortices occurred within the larger rotating smoke plume. Click here to see the original image from the scene above.
Nonetheless, a Parks Canada official noted that winds were intense enough to rip well-rooted, 260-270 year old Douglas Fir trees out of the ground. Evidence of backward convergence was also noted, as trees were observed to fall in the direction of the approaching vortex, before being burned (Canada Wildfire 2025a).
The backward convergence that likely occurred in all three cases may not necessarily be evidence of violent, EF4-5 vortex-generated wind speeds. It is also possible that a slower translational velocity of these vortices caused more sustained wind load on the affected mature lodgepole pine forests, subjecting them to strong winds for longer periods of time. Tornadoes in thunderstorms can move quickly along the landscape, especially in the supercell thunderstorms that form in environments of strong wind shear - with average forward speeds of at least 16-32 km/h (NOAA National Severe Storms Laboratory n.d.). Those generated by and anchored to wildfires may move more slowly, though our sample size of confirmed cases is too small to estimate an average forward speed - especially given the many potential genesis mechanisms of fire-generated vortices.
Another factor to consider could be the susceptibility of mature lodgepole pine forests to windthrow (uprooting). While lodgepole pine may be prone to blowdown in dense stands (Government of British Columbia 2025), this susceptibility may have been tempered somewhat by ongoing drought - since it is the presence of wetter soils that can make trees more vulnerable to windthrow (Kamimura et al. 2011). In any case, the presence of near total blowdown, along with the debarking of trees that was frequently observed, suggests that winds in all three cases were truly significant.
Meteorology:
Favourable atmospheric conditions, fuel continuity, and perhaps valley geography led to the maintenance of this longer-lived event in somewhat of a steady state. The meteorological background environment is essentially the same as that in Case B:
A favourable environment for plume-dominated wildfire behaviour, with light low level winds in the valley and steep low level lapse rates
Destabilization of the mid-troposphere, with a cooling and moistening profile aloft supporting the development of deep pyroCu and PyroCb
Strengthening vertical shear with height, leading to significant tilting of deep smoke plumes
After the sudden eruption of deep convection over the fire near 140PM MDT, as noted in Case B, archived visible and infrared satellite imagery indicate that deep pyroCu and pyroCb persisted over the fire for several more hours. According to ERA5 reanalysis sounding data, this convection didn't quite reach the tropopause, but was nonetheless deep, at upwards of 8 km above valley bottom. It is likely that strong jet stream winds aloft prevented the column from growing deeper. The effect of stronger winds aloft can be seen on the smoke plume at 28:30 in Canada Wildfire (2025a).
The first, sustained infrared brightness temperatures of -40°C or colder occurred above the fire beginning at 240PM MDT (figure 24). This roughly corresponds to the time that the most impressive images of the rotating smoke plume were captured, as it drove a true pyroCb above. During this time, between about 230PM and 257PM MDT, the fire was releasing truly fierce amounts of energy: Table 7 on page 50 of the NRCan report reveals an estimated head fire intensity (HFI) of 236,978 kW/m, a rate of spread at 5.5 km/h, and flame lengths up to 67 m. This rivals the energy release that was estimated with Alberta's infamous Chisholm fire of 2001, which had an HFI of about 225,000 kW/m as it generated one of the most intense pyroCbs ever observed (Wildfire Science Documentation Group 2012). It is also a prime example of why large vortices are important in wildland fire, given the associated increases in combustion rates, unexpected spread, updraft intensity, and ability to transport embers (Lareau et al. 2024).